Total Articles 238+

Best Practices

Highlights proven strategies, models, and success stories that drive effective sustainability outcomes.

Showing 12/54

29 Oct 2026

Delegation from Cushing Academy, Hyde School and Fay School visits Delhi and Mumbai to engage with Indian students, schools and families. New Delhi/Mumbai, October 2026: Strengthening educational ties between India and the United States, representatives from three leading American boarding schools — Cushing Academy, Hyde School and Fay School — participated in an educational outreach initiative organised by TALIEM – International Liaison Centre for Global Universities and Boarding Schools. The initiative facilitated interactions with students, educators and prospective families, highlighting opportunities offered by American boarding school education and encouraging international academic partnerships. Discussions also covered sustainability issues and the importance of environmental learning, emphasising the role of education in building environmental awareness and encouraging responsible practices among students. Visiting delegation & Taliem officials with Principal & Vice Principal of GD Goenka School, Vasant Kunj, New Delhi (From Left to right) Mr Pinku Biswas, Mr Paul J Abein, Dr Kevin Patrick Brady, Mr Kevin Smith, Ms Seema Sinha, Mr Ayan Biswas The delegation visited prominent schools across Delhi and Mumbai, including Apeejay School, Panchsheel Park; G.D. Goenka Public School, Vasant Kunj; Amity International School, Saket; and St. Xavier’s High School, Goregaon, Mumbai. Representatives also interacted with prospective families at local boarding school fairs.  With students of St Xaviers High School, Goregaon, Mumbai Kevin Smith of Cushing Academy appreciated the initiative, stating, “Supported by educational consultants Pinku and Ayan Biswas, my recent Cushing Academy outreach trip to India provided a wonderful platform to engage with leading school communities across Delhi and Mumbai.” The visits provided opportunities to discuss academic programmes, extracurricular activities, residential learning and the overall development offered by American boarding schools. The discussions also highlighted sustainability and environmental learning as important areas of student education, encouraging a broader understanding of environmental challenges and responsible decision-making. Mr. Ayan Biswas, Director of TALIEM, is warmly welcomed by Ms. Madhavi Gaonkar, Principal of St. Xavier’s High School, Mumbai, along with the students. Ayan Biswas, Director of TALIEM, praised the enthusiasm and engagement of Indian students. “Our interaction with the students was one of the highlights of the visit. We were genuinely amazed by the curiosity, confidence, and thought-provoking questions they raised. Their enthusiasm for learning, coupled with their discipline, respect, and cultured manner, was truly impressive and reflects the excellent values being nurtured by your school,” Biswas said. For Hyde School, the October visit marked an important step towards developing relationships with Indian students and families. Justin Fahey, Director of Enrollment & Financial Aid at Hyde School, expressed his appreciation, saying, “I am deeply grateful to TALIEM for welcoming Hyde to Mumbai. Their expertise and the depth of their connections across Indian and South Asian education are remarkable. The students and families I met here are curious, thoughtful, and ambitious, exactly the kind of young people who thrive at Hyde, and I look forward to a long and meaningful partnership.” Paul J. Abeln, Director of International Relations at Fay School, highlighted the value of direct engagement with Indian educational institutions. “Our hosts provided a welcoming atmosphere for families to meet with attending schools, and they also spent a significant amount of time in conversation with each school, educating us on the Indian market and learning from us about U.S. boarding schools. The school visits were particularly valuable. Each school community was extremely welcoming, providing direct conversations with management as well as visits with students and detailed tours of facilities. I am hopeful that my school can continue to work with TALIEM and enrich our relationship in the coming years,” Abeln said. TALIEM works with educational institutions across the United States, United Kingdom, Europe, Canada and Asia, facilitating student recruitment, international marketing, academic collaborations and institutional partnerships. The successful outreach initiative reflects the growing interest among American boarding schools in engaging with Indian students and families. By bringing together educational opportunities, sustainability discussions and environmental learning, TALIEM continues to strengthen Indo-American educational ties and create opportunities for long-term international academic cooperation. ...Read more

27 Oct 2026

Renewable capacity is expanding fast, yet coal still supplies most electricity. The data centre boom makes efficiency, distributed energy and climate resilience urgent public priorities. India is preparing to host an expanding artificial intelligence economy on an electricity system already being tested by hotter nights, rising cooling demand and uneven local infrastructure. The danger is that digital ambition becomes an excuse to prolong dependence on coal, appropriate scarce water and transfer infrastructure costs to ordinary consumers. A different outcome is possible. AI investment could finance cleaner electricity and more resilient networks, provided public policy makes those contributions a condition of expansion. Shankar Sharma’s Counterview article rightly connects India’s power difficulties with the growth of data centres and the climate crisis. Its emphasis on distributed renewables, storage and managing demand offers a useful starting point. But the argument becomes stronger when we distinguish installed machinery from electricity delivered, long-range forecasts from present consumption, and decentralisation from an assumption that national networks have become dispensable.[1] The paradox begins with installed capacity. As of September 30, 2026, India had approximately 558.8 gigawatts of installed electricity capacity. Ministry of New and Renewable Energy figures put renewable capacity, including large hydropower, at 299.25 GW, or about 53.6% of that total. Adding nuclear takes non-fossil capacity to 308.03 GW, approximately 55%. Renewables are already a majority of installed capacity; their contribution to actual generation remains much smaller.[2,3] Electricity sourceInstalled capacityCoal lignite gas and diesel combinedAbout 250.8 GWSolar171.05 GWWind59.20 GWLarge hydropower52.06 GWSmall hydropower5.18 GWBioenergy and waste to energy11.75 GWNuclear8.78 GWTotalAbout 558.8 GW Capacity snapshot at September 30, 2026. Rounded figures; large hydropower includes pumped storage. The fossil total is calculated from the reported overall and non-fossil totals.[2,3] The generation picture explains the paradox. The ministry’s April 2026 summary reported approximately 1,846 terawatt-hours of electricity generated in 2025–26. Fossil fuels supplied about 71%, renewables including large hydro about 26%, and nuclear roughly 3%. Renewables excluding large hydro contributed around 17%; solar and wind together approximately 15%. A terawatt-hour equals a billion electricity units. These annual shares, rather than capacity announcements alone, reveal how far India still has to travel.[4] Electricity also has to pass through an institutional and physical chain. Central utilities, state companies and private developers generate it; interstate and state networks transport it; distribution companies deliver it through substations, transformers and local feeders. Grid operators balance supply and demand continuously. Regulators determine tariffs and network access, while governments influence subsidies and investment. Captive industrial plants and local systems add further layers. Installing a solar panel solves one part of this chain. This is also a federal system. State regulators and utilities shape local delivery, while central institutions oversee interstate networks and national coordination. Power purchase contracts, open-access rules and electricity markets influence which plant supplies which consumer. Industrial captive generation and cross-border electricity trade add options. The resulting mix must provide voltage control, reserves and other services as well as sufficient annual energy. Electricity policy therefore cannot be reduced to a contest between two generation technologies. National adequacy can therefore coexist with poor service at a particular household or workshop. The government reported an aggregate energy shortfall of only 0.1% in 2024–25, a substantial improvement on earlier shortages. That measure cannot establish that every feeder has reliable voltage or every consumer receives uninterrupted supply. Local breakdowns, distribution constraints and difficulties purchasing power remain consequential even when national annual supply appears sufficient.[5] Several forces explain coal’s continuing dominance. Solar produces during daylight, with output affected by cloud, dust and temperature. Wind varies across seasons and locations. Hydropower depends on rainfall, river conditions and competing water uses. An installed gigawatt of solar consequently delivers fewer annual units than a gigawatt of coal operated for much of the year. Solar’s rapid recent expansion also means the year-end capacity figure includes plants that did not generate for the entire preceding year. Coal has an accumulated institutional advantage: established plants, fuel logistics, contracted payments and operating practices. Replacing its annual energy output also requires replacing the reliability services it provides at particular hours. Existing assets and long contracts can discourage change. Yet the transition still has to deliver dependable power through long summer nights and weak renewable periods. India needs cleaner firm supply and flexibility that can actually be dispatched when required. Geography compounds the difficulty. Renewable resources are concentrated in particular states, while electricity must serve widely dispersed industries and cities. A generating station may be commissioned before the transmission line or substation needed to carry its output. Congestion, inadequate flexibility and operational restrictions can force renewable generators to reduce production even while another area needs electricity. Such curtailment represents a failure to coordinate generation, networks and demand; installing further capacity alone cannot resolve it.[6] Investment must follow that diagnosis. The government’s July 2026 parliamentary reply identified an estimated ₹9.16 lakh crore of transmission investment under the 2022–32 National Electricity Plan. The critical issue is coordinated execution: renewable plants, lines, substations and storage must become usable together. Modern grid-support equipment and capable inverters also matter as the generation mix changes. Public reporting should show electricity successfully delivered and reliability achieved, alongside expenditure and kilometres of line constructed.[9] Distribution reform is equally important. National aggregate technical and commercial losses fell from 21.91% in 2020–21 to 15.04% in 2024–25. This indicator includes billing and collection problems alongside physical losses; treating the entire percentage as electricity disappearing from wires would be misleading. Better conductors, transformers and maintenance can save energy, while accurate billing and timely subsidy payments improve the finances needed to purchase clean power and maintain service.[5] Rooftop solar can complicate those finances when higher-paying consumers buy less grid electricity while the distribution company retains network costs and subsidised customers. Regulators should reward utilities for integrating local generation, maintaining reliability and reducing physical losses. Transparent compensation for network services and timely public funding of social subsidies would help prevent a transition in which affluent consumers capture the benefits and poorer households inherit rising costs. Energy efficiency deserves comparable investment. Efficient motors and pumps, reduced industrial waste and better building design can relieve demand without reducing useful services. For scale, an illustrative saving equal to 5% of the reported 2025–26 generation would amount to roughly 92 TWh. This is an arithmetic comparison, not a forecast of achievable savings. It nevertheless shows why public policy should compare the cost of avoiding waste with the cost of adding generation and networks. Distributed energy offers a substantial opportunity because production can be placed close to useful demand. School roofs, hospitals, railway premises, warehouses and factories can generate electricity where daytime consumption already exists. India’s grid-connected rooftop solar capacity reached 33.41 GW by September 2026. The scale is becoming significant, but installation quality, maintenance and usable electricity matter as much as the number of beneficiaries announced.[2] For a school or primary health centre, solar paired with properly sized storage can support fans, lighting, communications and essential refrigeration during interruptions. In cyclone-exposed places such as the Sundarbans, such systems should be designed around emergency services, elevated equipment and local repair capacity. Ordinary grid-connected solar usually disconnects during an outage for safety. Continuing service requires appropriate controls, storage and equipment that can operate safely apart from the grid. Gujarat’s Dhundi solar irrigation cooperative demonstrates how institutional design can improve the value of a technology. Farmers use solar electricity for irrigation and sell surplus power to the utility. Payment for electricity creates an incentive to conserve energy and water, instead of pumping merely because sunlight appears free. The broader lesson is that solar irrigation needs groundwater safeguards and remunerative export arrangements; otherwise cheap pumping can aggravate depletion.[7] Access must extend beyond households that own suitable roofs and can obtain loans. Community solar, shared installations for apartments, public buildings and affordable service contracts can include tenants and poorer families. Local technicians need training, spare parts and viable maintenance businesses. Decentralisation becomes meaningful when communities gain dependable service and bargaining power, rather than responsibility for equipment they cannot afford to repair. Sustainable expansion also requires discipline about land and materials. Agrivoltaics can combine farming with electricity production where crop choice and design permit, while carefully sourced agricultural residues can support local bioenergy. Neither label guarantees environmental benefit. Food production, biodiversity, soil needs and air quality require protection. Batteries and solar equipment need repair, collection and recycling systems. A clean electricity transition should reduce environmental burdens over its lifecycle rather than relocate them. Storage then connects generation with the hours when electricity is needed. A battery rated at one gigawatt with four gigawatt-hours of usable energy can deliver full output for roughly four hours; the power rating alone says little about endurance. Batteries can absorb solar production, reduce evening peaks and respond quickly to disturbances. Longer shortages require a portfolio of resources. Pumped storage may help where environmental assessment supports it, but neither batteries nor reservoirs create energy. Virtual power plants can coordinate rooftop batteries, controllable pumps and electric-vehicle charging as a collective grid resource. Time-sensitive tariffs can encourage willing consumers to shift flexible activity towards plentiful supply. These arrangements require dependable communications, cybersecurity and consumer consent. Essential cooling and medical needs need protection. Demand management should reward flexibility; it should not become a sophisticated means of rationing electricity to people with little political influence. A distributed revolution nevertheless needs a strong wider grid. Regional connections allow electricity to move between different weather conditions and demand patterns. Large renewable parks can complement local generation. Nuclear can provide low-carbon electricity, although it is not renewable and its costs, construction times, water requirements and waste obligations require scrutiny. Each investment should be assessed against realistic alternatives. Blanket rejection of transmission, nuclear or pumped storage would narrow India’s options prematurely. AI introduces a new concentration of demand into this complicated transition. The International Energy Agency’s 2026 update estimates that global data-centre electricity consumption reached 485 TWh in 2025 and could rise to approximately 950 TWh by 2030. AI-focused facilities grew faster than the sector overall. These totals cover data centres, including other digital services; they should not be presented as the footprint of generative AI alone.[8] For India, the government told Parliament in July 2026 that AI data centres could add 26.3 GW of load by 2031–32, expected to be integrated into the grid and primarily served by renewable capacity. Separately, Wood Mackenzie projected Indian data-centre electricity use reaching 191 TWh by 2040. That is the year attached to the striking figure cited in the Counterview discussion. Both are forecasts with different boundaries and units, rather than measurements of today’s consumption.[9,10] The investment commitments are substantial. Google announced a $15 billion programme for an AI hub in Visakhapatnam and reported breaking ground in April 2026. Its plans include gigawatt-scale computing, transmission, clean generation and storage. Such commitments show how computing and electricity infrastructure are becoming linked. They also create a clear public test: whether promised energy and community benefits are delivered alongside the computing capacity, with independently verifiable results.[11] The arithmetic makes the stakes tangible. An illustrative facility with 100 megawatts of continuously operating IT equipment and a power usage effectiveness of 1.2 would draw 120 MW overall, consuming approximately 1.05 TWh annually. That calculation assumes full utilisation throughout the year; real demand varies. Power usage effectiveness measures total facility electricity against IT electricity. It can identify cooling and electrical overheads, but cannot tell us whether the computing itself performs useful work efficiently. The immediate pressure can be highly local. A large facility may need new transformers, redundant connections and substantial dependable supply in one urban corridor. AI equipment also produces rapid power fluctuations that require careful management. Some training and batch processing can move to different hours or locations; interactive services have tighter response requirements. Operators should disclose and contract the flexibility they can genuinely offer, rather than promising that every workload can follow sunshine.[8] Water makes siting especially consequential. Cooling can consume water directly, and electricity generation adds an indirect water footprint. Liquid cooling at the chip does not by itself establish that the entire facility uses little water: heat still has to be rejected somewhere. Treated wastewater, dry cooling and hybrid designs deserve site-specific evaluation, including energy trade-offs. A low-carbon electricity contract cannot compensate a neighbourhood for an aquifer depleted during summer. Green AI addresses the computing side of this problem by treating environmental performance as a lifecycle discipline. Accounting must include experimentation, training, routine inference, cooling, hardware manufacture and eventual disposal. It must also preserve useful performance. A smaller model that repeatedly fails, triggers retries or demands extensive correction may consume more resources per completed task than a better-designed alternative.[12] Practical choices begin with selecting the smallest system that reliably accomplishes the task. An Indian-language information service may need a specialised model grounded in approved documents, rather than a frontier model for every request. Quantisation reduces numerical precision and memory requirements; distillation transfers capabilities to smaller models. Caching avoids repeated calculations, while efficient batching can improve hardware utilisation. Savings depend on workload and implementation, so procurement should require measurement rather than assume that any technique guarantees lower impact. Model cascades send simpler requests to smaller models and reserve more demanding systems for difficult work. The FrugalGPT research reported reductions of up to 98% in inference cost on selected benchmarks while matching a stronger individual model’s performance. That finding supports selective routing. It does not establish a universal 98% reduction in electricity or carbon emissions, because commercial prices and physical resource use are different measures.[13] Autonomous agents need additional restraint. A single instruction can generate repeated searches, model calls and unsuccessful attempts. Limits on steps, output length and retries, together with detection of unproductive loops, can reduce waste. The relevant question is how much energy a successfully completed task required, including failed attempts. Evaluations should test quality on Indian languages and real operating conditions, where poor performance could erase apparent savings. Measurement should make comparisons fair. Google’s study reported 0.24 watt-hours for a median Gemini Apps text prompt in May 2025. This was a company-specific, dated observation, not a universal footprint for AI. Longer reasoning, video generation and agent workflows can require substantially more energy. Organisations should publish task definitions and quality thresholds alongside facility-adjusted electricity, emissions, water and hardware impacts, with annual absolute totals to expose growth hidden by improving averages.[14] Energy procurement needs similar honesty. Matching annual consumption with renewable purchases does not prove that clean electricity was available in the relevant grid every hour. A data centre can claim annual matching while relying on fossil generation after sunset. Contracts that support additional clean capacity, storage and verifiable hourly matching offer a stronger pathway. India should progressively tie fiscal incentives and public AI contracts to that standard, while requiring disclosure of residual fossil dependence.[15] Efficiency alone cannot guarantee falling demand. If electricity per task halves while the number of tasks quadruples, total use doubles. This rebound effect makes absolute resource budgets and scrutiny of applications necessary. Public agencies should favour demonstrable services such as accessible information, grid forecasting or carefully validated agricultural advice. Deploying computationally intensive systems for routine functions without comparing simpler alternatives wastes both money and scarce infrastructure. AI can also help the transition by improving renewable forecasts, detecting equipment faults, managing charging and coordinating storage. These uses should be evaluated against a credible baseline: how much additional renewable electricity was delivered, how much physical loss was avoided, and what reliability improved? Emissions savings claimed elsewhere in the economy should be reported separately from a company’s own footprint. Promised benefits cannot substitute for controlling the resources consumed by the AI system. Climate change makes delay increasingly expensive. The IEA’s analysis of May 2026 showed India reaching 270 GW of peak demand on May 21, with rising nighttime cooling needs becoming a particular challenge as solar output disappears. It projects cooling demand more than doubling by 2035 under current policy settings. Efficient air conditioners, building standards, shade and passive cooling therefore belong inside electricity strategy, alongside new generating capacity.[16] Climate hazards also weaken supply. Drought can constrain thermal-plant cooling and hydropower; floods and cyclones can damage substations and lines. IEA and CEEW analysis has documented the vulnerability of India’s coal fleet to water stress. Adding data-centre demand without planning for these conditions risks a damaging feedback: more fossil generation increases emissions, warming raises cooling requirements, and heat and water constraints make reliable electricity harder to provide. Local resilience and emissions reduction must advance together.[17] India should require large data-centre proposals to demonstrate grid readiness, additional clean supply, credible water budgets and climate-resilient design before receiving major concessions. Developers should pay a fair share of attributable network costs and provide financial safeguards against abandoned expansion plans. Regulators should publish connection queues and resource commitments. Communities need accessible information and enforceable service protections. These requirements would turn investment announcements into obligations that citizens can assess. The wider transition must protect coal-dependent workers and districts through retraining, economic diversification and rehabilitation of damaged land. It should also build Indian capabilities in storage, power electronics, efficient models, maintenance and environmental auditing. Renewable deployment offers greater public value when its supply chains, employment and ownership opportunities are deliberately developed, and when affordable electricity remains a central measure of success. AI becomes a long-term curse for Indian sustainability if unlimited computing is treated as an entitlement while clean electricity, water and climate stability become somebody else’s problem. India cannot stop global warming by itself, but it can decide how its digital expansion affects emissions and resilience. The test is whether AI helps deliver worthwhile services within a declining environmental burden. A future that requires sacrificing reliable household electricity and water to sustain ever-growing computation would fail that test. Sources and data notes Capacity data are dated September 30, 2026. Generation shares refer to the ministry’s April 2026 summary for FY 2025–26 and are rounded. Forecasts are identified separately from measured consumption. The main feature is approximately 2,930 words, including the capacity table and its note. [1] Shankar Sharma, India’s power paradox, Counterview, 18 October 2026 [2] MNRE, Physical Achievements, capacity data at 30 September 2026 [3] Akashvani, India at the East Asia Summit Energy Ministers’ Meeting, 8 October 2026 [4] MNRE, India Ranks Third Globally in Renewable Energy Installed Capacity, 8 April 2026 [5] Ministry of Power, Availability and Quality of Power Supply, 12 March 2026 [6] IEA, Renewables Integration in India, 2021 [7] IWMI, Solar Irrigation for Agricultural Resilience, Dhundi cooperative account [8] IEA, Key Questions on Energy and AI, executive summary, 2026 [9] Ministry of Power, Rajya Sabha Unstarred Question 956, 27 July 2026 [10] Wood Mackenzie, India Data Centre Capacity to Reach 12 GW by 2030, 27 July 2026 [11] Google, Google AI Hub Scaling India’s AI Infrastructure and Community Impact, 28 April 2026 [12] Prof Ujjwal K Chowdhury, Building the Frugal Machine Inside the Real Push for Green AI, supplied document GreenAIDetails(2).docx [13] Lingjiao Chen, Matei Zaharia and James Zou, FrugalGPT, 2023 [14] Google, Measuring the Environmental Impact of Delivering AI at Google Scale, August 2025 [15] Google, Clean Energy 24x7 Carbon Free Internet, annual versus hourly matching [16] IEA, India’s Electricity Demand Grows at Night, 3 June 2026 [17] IEA and CEEW, Managing the Water Energy Nexus Is Vital to India’s Future, 22 March 2021 ...Read more

26 Oct 2026

Nineteen deaths at a Puja pandal and widely reported attacks on bookstalls in Bengal expose a government facing two tests of public responsibility — protecting citizens in a crowd and protecting their freedom to think, explains Prof Ujjwal K Chowdhury. Durga Puja promises a temporary enlargement of ordinary life: streets become galleries, neighbourhood welcome strangers, and families reclaim the city after dark. At Chorbagan in north Kolkata on October 17, that promise ended in a crowd disaster. Reports available on October 19 put the toll at 19 dead and around 25 injured. Each death demands an explanation of how a visit to a community festival became fatal. [1] During the same festival, Left organisations reported attacks on their bookstalls, while municipal and police action against stalls generated separate disputes over permissions and selective enforcement. The CPI(M) blamed BJP supporters for the attacks; BJP state president Samik Bhattacharya denied that his party had directed them. Responsibility for individual incidents requires investigation. The government's obligation to protect lawful activity requires no such clarification. [2] The BJP government's first Durga Puja has exposed a destructive imbalance in the exercise of power. Its administration must answer for grave failures of public protection, while its leadership's interventions over bookstall language raise disturbing questions about ideological conformity. A government claiming stewardship of Bengal's greatest festival must accept scrutiny of both. The criticism must remain precise. An elected government is answerable for the institutions it commands; allegations against particular organisers still require evidence. Neither principle cancels the other. Warnings before the deaths The early reporting describes a hazardous combination: constricted lanes, a single exit, inexperienced crowd handlers, heavy rain and confusing announcements. The Indian Express reported, citing police sources, that barricades had been breached at least ten times on the preceding Friday. That detail transforms the accountability question. Dangerous pressure apparently announced itself before the fatal evening. Who recorded those breaches, and who decided the arrangements could continue? [3] The human cost appears in survivor Ram Sarkar's account to the newspaper. He described struggling to extract his wife, Arti, from the crush and attempting resuscitation; she died. Local rescuers described carrying victims through narrow lanes towards the main road. Their efforts deserve recognition. Families should never have had to depend on improvised rescue to survive an officially permitted celebration. [3] Rain belongs in an explanation of the sequence. It cannot serve as an administrative alibi. A major outdoor festival must anticipate visitors seeking shelter and changing direction. A plan that functions only while everybody continues moving exactly as expected offers inadequate protection. The Times of India subsequently reported preliminary investigative findings of no structured evacuation plan, poorly regulated movement and inadequate coordination between police, private security and volunteers. These remain findings under investigation, but they indicate failures across several layers of responsibility. [4] India's National Disaster Management Authority had already identified restricted exits, inadequate holding space, conflicting crowd flows and deficient communication among the dangers at mass gatherings. Its 2014 guide calls for coordinated preparation and monitoring. Bengal's administration did not need to invent the fundamentals after Chorbagan. It needed to implement them before admitting visitors. [5] The operational questions are concrete. What was the safe capacity? When should incoming visitors have been stopped? Who could order that stop? Could people leave a queue midway? Were emergency routes usable when most needed? A permission certificate means little unless somebody checks whether the arrangements described on paper exist on the ground. Political patronage and public duty Reporting has brought the organisers' political connections into scrutiny. The New Indian Express described publicity material shared by the Opposition listing the chief minister's nephew Debdeep Adhikari as chief patron, Jorasanko BJP MLA Vijay Ojha as chairman and north Kolkata BJP leader Tamoghna Ghosh as chief adviser. Bhattacharya questioned the allegation concerning the nephew, saying he understood him to be a minor living in Kanthi. These competing accounts must be tested against original committee records. [6] Political proximity establishes neither criminal guilt nor innocence. It does establish why an investigation must examine the whole decision chain. Did patrons exercise influence over appointments, permissions or operational decisions? Were officials free to insist on restrictions? Were experienced personnel displaced without preserving their knowledge of the locality? The later Times of India report says organisers acknowledged a change of team and inadequate experience of managing large crowds in the narrow lane. It also reports investigators examining whether police deployment favoured VIP entrances over general access points. Neither finding should be inflated into a completed verdict. Both demand answers from those above the volunteers. [4] The accountability structure must match the authority structure. If leaders claim ownership of a festival's success, they cannot become ornamental figures when its arrangements collapse. Conversely, prosecution must follow demonstrable responsibility. Arrests cannot be substitutes for identifying who approved an unsafe system and who ignored its warnings. Seven people, including committee office-bearers, have been arrested, according to reporting. That begins a process; it does not establish guilt or complete the government's account of its own conduct. [6] When spectacle distorts administration The danger of publicity-led governance is an incentive problem. Dense crowds produce impressive images; restrictions produce complaints. Inaugurations bring visibility; rehearsing evacuation attracts little attention. Unless institutions resist these incentives, organisers may receive political rewards for attracting people without equivalent pressure to keep numbers manageable. An authoritarian performance of masculinity can deepen that problem when caution is treated as weakness and domination as competence. Officials then have reasons to conceal limits, while political workers gain approval through aggressive displays. This is an argument about organisational culture, not a diagnosis of individual leaders. Competent administration needs people who can tell a powerful patron that a venue is full, an entry must close or a favoured arrangement is unsafe. A culture that makes such candour costly undermines its own capacity to protect life. Allegations that crowds were deliberately concentrated for drone footage remain unproven. Photographs of packed venues and quieter streets cannot establish such a design. Investigators would need instructions, deployment records, communications and verified timelines. A serious critique loses force when speculation is allowed to outrun evidence. There is, however, no need to prove a publicity conspiracy to establish a planning failure. An event can become dangerously crowded through neglect, misplaced confidence or unwillingness to interrupt a successful-looking spectacle. Failure to intervene remains consequential even without an intention to cause harm. The same discipline applies to claims that visiting time was cut by five days or VIP queues moved five times faster. Those figures need documentation. The principle survives without them: opening schedules should distribute demand, and privileged entry must never obstruct safe movement. NDMA's guide explicitly contemplates refusing VIP entry when safety requires it. [5] The attempt to prescribe public culture The bookstall controversy has its own evidence. The Indian Express reported allegations that masked men vandalised CPI(M) stalls in Bardhaman despite an advance request for protection. Its report also recorded a Left leader acknowledging attacks during the previous TMC administration. Bengal's history therefore offers no licence for partisan innocence. Earlier intimidation creates an obligation to break the practice. [2] There is also documented political context. In September, Chief Minister Suvendu Adhikari urged Puja committees to allow Marxist stalls with banners saying “Durga Puja” rather than “Sharodotsav”. The remarks were reported during an Assembly debate on university administration. [7] That intervention matters because it makes language a condition of cultural legitimacy. “Sharodotsav” allows people to describe their relationship to the season through a broader cultural vocabulary. Devotees remain entirely free to call their worship Durga Puja. A chief minister should protect both expressions. State authority becomes coercive when one preferred description determines whose participation is acceptable. This is how regimentation can operate without a formal ban on a book. First establish an approved vocabulary; then portray departures as disrespect; finally make the dissenter defend the right to occupy public space. Readers begin to encounter political permission where they should encounter competing arguments. Calling this a danger to education concerns the method of learning itself. Education requires the ability to examine an argument, identify its evidence and reject it intelligently. Threatening a seller teaches that a label is sufficient grounds for punishment. It rewards obedience and makes independent judgement socially costly. Permission cannot become a political weapon Protecting bookstalls does not exempt them from safety rules. At Jadavpur, The Times of India reported that a municipal earthmover arrived after police alleged missing permission. Stall representatives disputed that account and said they possessed documents. The permits, notices and written instructions should settle the dispute, rather than rival assertions backed by unequal force. [8] The Bongaon litigation also needs accurate treatment. Court reporting says a division bench stayed an earlier protection order and called for removal of stalls lacking permission, including scrutiny of a Hindu Jagran Manch stall. That cannot fairly be represented as an unconditional judicial endorsement of every Left stall. Equally, it cannot justify selecting stalls for removal according to ideology. [9] A neutral administration should publish clear requirements, explain refusals and apply equivalent standards to comparable structures. Violence against a seller remains a separate matter requiring investigation even where permission is disputed. An administrative defect gives no political group authority to assault people or destroy property. Defending this freedom requires no endorsement of Marxism, Stalinism or any other doctrine on sale. Readers must remain free to criticise their histories and conclusions. The democratic failure begins when an organisation replaces that argument with intimidation. Young people recruited against their futures The young person who attacks a bookstall is responsible for the act. Understanding how such recruits become useful to political organisations helps explain the damage beyond the immediate victim. A system that offers status through intimidation can give a directionless young person recognition quickly, while asking little intellectual effort and rewarding aggression. No photograph or brief video establishes someone's education, employment or private motives. Poverty does not make a person violent, and political commitment does not make a young activist a thug. The relevant question concerns recruitment: what conduct earns approval, protection and opportunities within an organisation? Where coercion earns those rewards, a destructive dependence can develop. An activist becomes known for threats rather than useful skills. Criminal allegations may narrow employment prospects. A patron's promise of protection may make leaving the network harder. These are possible mechanisms of entrapment, not a prediction about any identified individual. The unequal distribution of risk deserves scrutiny. An influential organiser may have lawyers, income and connections. A recruit may face prosecution, injury and lasting notoriety. Political loyalty provides no reliable compensation for a damaged working life. Any claim of youth empowerment should be judged partly by whether it expands young people's choices or makes them dependent on patrons. Bookstall intimidation is therefore an educational failure with a political purpose. It trains participants to classify an author as an enemy before considering an argument. It also trains spectators to calculate whether expressing an opinion is worth the risk. A handful of violent acts can narrow the intellectual freedom of many more people. The alternative is practical. Young volunteers could gain recognised training in crowd safety, first aid, accessible event design and communication. Such work creates transferable abilities and public trust. Those recruited to police other people's reading deserve opportunities to build lives beyond enforcing somebody else's authority. A government strong where restraint was needed The juxtaposition of bookstall enforcement and Chorbagan's failures raises a serious question about priorities. It does not, by itself, prove that particular officers were diverted from the pandal to a demolition operation. That requires deployment records. It does require the government to explain how it allocated attention, personnel and command responsibility across the festival. Administrative force is highly visible when an earthmover confronts a stall. Effective public protection depends on less theatrical work: maintaining routes, monitoring pressure, coordinating responders and acting before danger becomes a disaster. A government can display the first capacity while neglecting the second. Chorbagan may also reveal a wider inspection problem. The later Times of India report describes post-disaster fire-service notices to Ballygunge Cultural Association and Chetla Agrani over deficiencies including lighting and obstructions. Each venue requires its own assessment. Their discovery nevertheless raises the question of what earlier inspections established. [4] There is a particularly painful gap between commitment and practice. UNESCO reported before the festival that the Bengal government had joined an accessibility initiative and that organisers had received training. That initiative deserves support. Its promise will be credible only when people with disabilities, older visitors and families can participate safely in the actual streets and pandals. [10] Accountability while the evidence is fresh Adhikari has proposed a probe headed by a sitting judge, subject to the High Court's agreement, or a retired judge otherwise. He has said the roles of police and fire officials will be examined. These commitments should be acknowledged and converted into published terms, independent expertise and a deadline. An announced inquiry is still a promise of accountability. [3] The inquiry should secure CCTV footage, crowd assessments, permissions, deployment rosters and communications before evidence disappears. It must reconstruct the earlier barricade breaches alongside the fatal evening and distinguish organisational decisions from individual conduct. Victims' families need access to findings and a credible way to submit evidence. Immediate protection cannot await the final report. High-risk venues require independent checks, workable entry limits and authority to pause admission. Emergency arrangements must be rehearsed. Assistance for disabled visitors must preserve their safety and dignity. Survivors need continuing treatment and rehabilitation, while bereaved families need support that extends beyond an announcement. The BJP government's first year offers no exemption from these duties. It can acknowledge inherited weaknesses and still answer for present decisions. Its treatment of dissent will also shape whether warnings reach officials: a system that punishes uncomfortable voices makes honest reporting harder precisely when public safety depends on it. Chorbagan's dead and Bengal's threatened booksellers impose a common test on public power. Citizens must be able to enter a festival without surrendering their safety and encounter a book without seeking ideological permission. A government seeking authority over Bengal's public culture must first demonstrate that it can protect the people who create and share it. Sources: Reporting available on 19 October 2026 [1] Associated Press, Stampede at a popular Hindu festival in eastern India kills 19, 18 October 2026. [2] Atri Mitra, The Indian Express, Attacks on Left book stalls mark a turbulent Durga Puja for CPI(M), 18 October 2026. [3] Ravik Bhattacharya and Sweety Kumari, The Indian Express, Kolkata stampede Ropes dropped one exit warnings that led to panic, updated 19 October 2026. [4] Subhro Niyogi and Tamaghna Banerjee, The Times of India, No emergency evacuation plan panic announcement led to stampede, 19 October 2026, 21.19 IST. [5] National Disaster Management Authority, Managing Crowd at Events and Venues of Mass Gathering, 2014, especially printed pages 14, 22, 29 to 31 and 50 to 51. [6] The New Indian Express, Kolkata stampede Mamata AITC targets CM Suvendu questions nephews role in puja committee, 18 October 2026. [7] Atri Mitra, The Indian Express, Write Durga Puja not Sharodotsav Suvendu takes a dig at CPI(M) bookstalls, 10 September 2026, updated 11 September. [8] Dipawali Mitra, The Times of India, Tension grips Jadavpur as earthmover rolls in to raze CPM book stalls, 18 October 2026. [9] The Times of India, Calcutta High Court stay on police cover for CPM book stall removal order for illegal stalls, 17 October 2026. [10] UNESCO, Government of West Bengal joins UN in India and UNESCO to make Durga Puja accessible, 5 October 2026, reporting the initiative of 30 September. ...Read more

26 Oct 2026

  Summary: Every year every nook and corner of West Bengal gets decorated to celebrate Durga puja. Somewhere it is celebrated in traditional manner while somewhere it is celebrated keeping various themes in mind. Every year all the puja organizations and clubs get ready to compete with each other regarding the various themes put up. This often results in crowd and sometimes mishaps occur just as this year Chorbagan Durga Puja has witnessed. A vigilant team with an adept crowd management system is the need of the hour in order to rule out any chance of casualties.  At least 19 people died and 50 others were injured in a stampede at Chorabagan Durga Puja pandal in North Kolkata on 17 October evening. The dead included 13 women and a child. The last major stampede during Durga Puja took place at Deshapriya Park in 2015 when a huge crowd converged to view the world's largest Durga Idol. Several people fell ill but suffered no death.   Causes:  Local residents blamed poor crowd management for the disaster. The policemen and the volunteers were not seen in the place at the time of disaster. A huge crowd waiting in the narrow Radha Madhab Saha Lane to enter the Puja pandal suddenly surged ahead when sudden downpours began around 7.15 pm. There was also a huge gathering at that time inside the pandal. Suddenly exit and entry were almost blocked. There was an announcement of collapse of the ramp which spread panic among the people. This misleading announcement by the Puja Committee added to the chaos. A sudden and unexpected sharp spell of shower for an hour on Saturday evening spelt disaster for revellers at the Chorabagan Puja Pandal. The rain turned the ground soggy making foothold difficult, contributing to the stampede, according to the weather officials. According to witness, thousands of people were waiting to enter the Puja pandal when the skies opened up. The pandel design, which required visitors to take a flight of stairs from an upper deck to the lower level near the exit, contributed to the disaster.  Doctors at Medical College Kolkata said the deaths were mostly due to suffocation. Many of the victims also had injuries due to stampede.  The conclusions:    Failure to seperate entry and exit ----------------- people couldn't move freely at the time of crowd Surge.    Inadequate police deployment ------------------------ insufficient personnel at critical points to control the crowd.    Possible deficiency in emergency planning --------------------- delays in identifying the danger, evacuating visitors and assisting injured people.    Inadequate crowd management -----------------the number of visitors exceeded the capacity inside and outside the Puja pandal .    Narrow entry and exit routes ----------------------people could not move when the crowd surged.    Confusing announcement -------------------------- unclear and misleading instructions had triggered panic and sudden move of the crowd .    Following the administrative instructions major pujas across Kolkata started shutting down from 8pm on Saturday, bringing pandal -hopping to an abrupt halt.  After the Chorabagan Puja incident Chetla Agrani stopped the entry point before a crowd surge. Durga Pujas , including Tala Prattay, College Square and Md Ali Park were shut down as a precautionary measure.    Sabyasachi Chowdhury of Chetla Agrani said a sharp spell of shower on Saturday, 17October, led to a huge crowd build up inside the pandal. The volunteers were concerned and , "we closed entry gates, opened the exits and removed all barricades so that the people could disperse quickly."  In 2015, when stampede broke out at Deshapriya Park, the main gate was locked at once. An announcement was made to disperse the crowd into the nearby alley, the avenue beside Deshapriya Park. People crossed the railings of road dividers and also metro station gates, railway stations were blocked in order to safely disperse the crowd gathered. Without any casualty then, the Kolkata police had successfully managed the stampede within half an hour. However, this time, the police were busy dismantling bookstalls rather than providing immediate help in case of stampede.  Stampede at Chorbagan Durga Puja Pandal, Kolkata Public grievance: The emergency department of Calcutta Medical College and Hospital was gripped by chaos and grief as stampede victims started being rushed around Saturday 8 pm. Victims of the stampede continued to be brought to the hospital till 10 pm.  The people were angry at the lack of arrangements and claimed the victims were brought to the hospital in private cars and cabs.  Priya somaddar, 20, from Madhyamgram was out pandel -hopping with a friend. Her father Shyamal Samaddar, was inconsolable at the hospital after being told of her death. " She came with her friend. They visited many pandels before going to Chorabagan. Her friend called me up at 8.30 pm and gave me the news. I rushed to the hospital, but they are not allowing me to see my daughter, I will never forgive those who are responsible for her death " he said. Outside the hospital, police personnel and vehicles lined the area as senior ministers, BJP functionaries and police officials arrived in convoys. Several angry relatives tried to approach the visiting officials, but were stopped by the police.  Immediate steps to be taken:   Best possible treatment for all injured people. Financial assistance to the families of the victims without delay. Psychological support for the survivors and bereaved families. Verified list of the deceased and injured persons to be published. Proper investigation of the disaster to be initiated immediately. Police personnel, puja organizers. Private security agency and the contractors responsible for pandal construction should be under investigation process. Responsible individuals should face appropriate legal action. Conduct emergency safety inspection, temporary close down of the pandals which are not following safety measures and safe crowd management. Deployment of sufficient police and trained crowd management personnel. Install good public address system c. Prepare efficient evacuation plan.  Keep ready ambulance and medical practitioners.   The Chief Minister has announced a 25 lakh rupees compensation and a Group D government job for the family of each person killed in the stampede at Kolkata’s Chorbagan puja pandal.  Sources:  Tamaghna Bannerjee, CM Blames Organisers, says , 'Action will be taken ' The Times of India, 18 October , Kolkata .  Zeeshan Jawed, As festival turns into tragedy........, The Times of India, October 18, Kolkata .  Prithvijit Mitra, Sharp spell turns ........ Death trap, The Times of india, October 18 , Kolkata . Shantanu Ghosh, Milan Haldar, mondope podopristho,mrito 19 , Anandabazar potrika , 18 October Kolkata.  ...Read more

13 Oct 2026

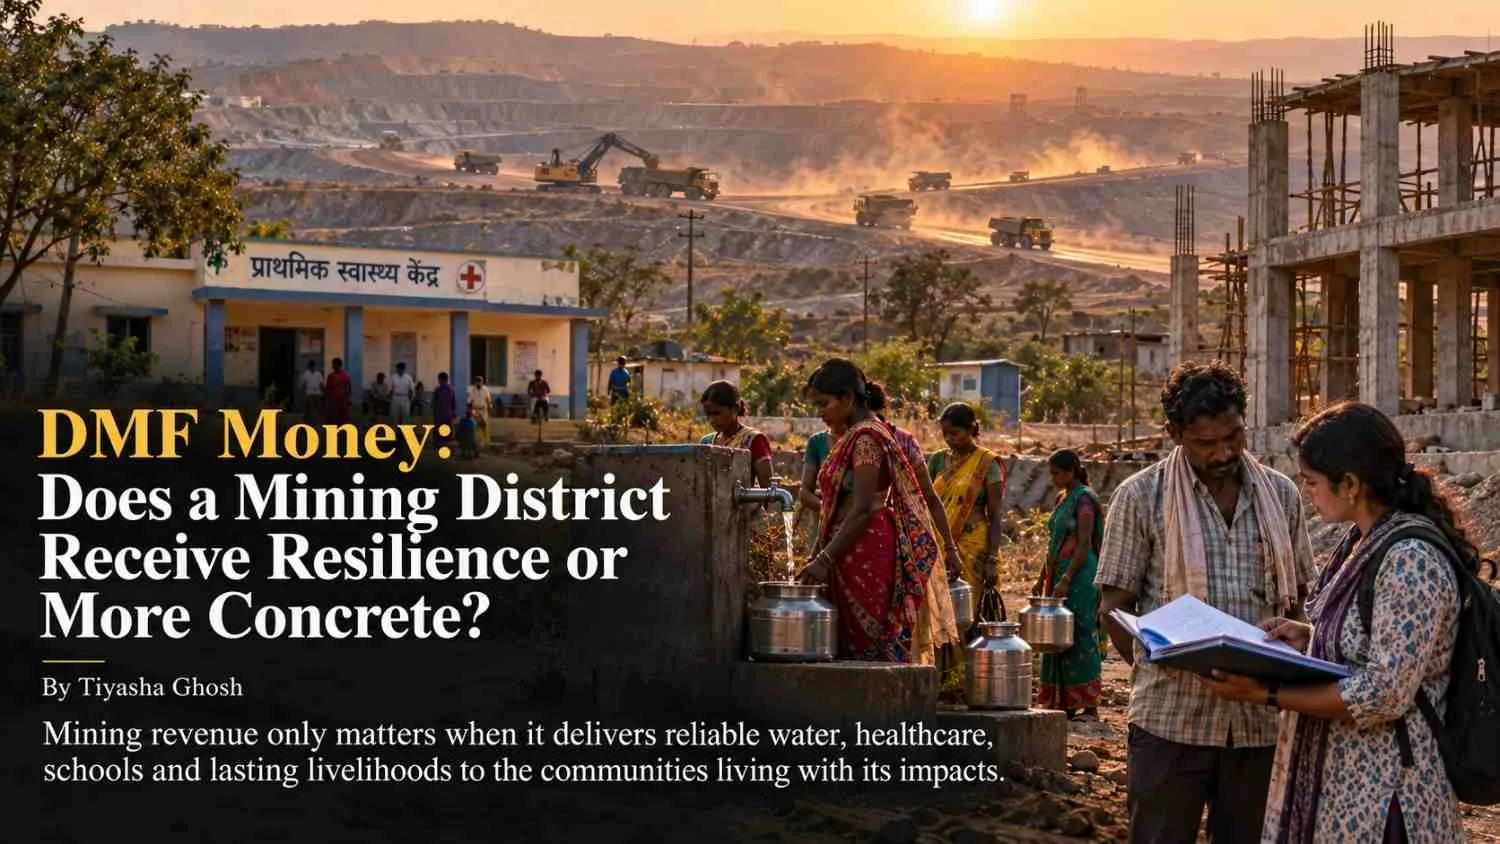
13 October, 2026 | Kolkata Mining generates public revenue, but the real test is whether that money delivers reliable water, better healthcare, stronger schools and lasting livelihoods for the communities living with its impacts. SummaryDistrict Mineral Foundation (DMF) funds are meant to improve the lives of people affected by mining. Yet money sanctioned for a project does not automatically mean that the project is complete, functional or benefiting the intended community. Starting with Keonjhar, Odisha, this investigation traces public records from fund collection and approvals to expenditure, completed work and services on the ground. If a district receives mining revenue, how can residents know whether it is improving their lives? The money is collected. What happens next? Mining brings revenue to the government, but it can also place pressure on local water resources, land, health and livelihoods. For communities living close to mining operations, the benefits of mineral wealth should therefore extend beyond the value extracted from the ground. The District Mineral Foundation was created under the Mines and Minerals (Development and Regulation) Act, 1957, through its 2015 amendment. DMFs are non-profit trusts established in mining-affected districts to work for the benefit of affected people and areas. Their funds come from statutory contributions by mining leaseholders. The Pradhan Mantri Khanij Kshetra Kalyan Yojana (PMKKKY) provides the framework for using this money for development and welfare. The intended priorities include drinking water, healthcare, education, environmental protection, sanitation, support for women and children, skills and livelihoods. Under the revised 2024 guidelines, at least 70% of DMF funds must be directed towards directly affected areas and high-priority sectors. But a policy commitment is only the starting point. To understand whether DMF spending is delivering its intended benefits, the financial trail must be followed beyond the approval stage. A large fund, but what does the spending show? The scale of DMF funding makes public scrutiny important. According to the Ministry of Mines, by November 2024, DMFs across India had collected ₹1,02,083.03 crore. Of this, ₹87,357.28 crore had been sanctioned for 3.60 lakh projects, while ₹54,892 crore had been spent. The ministry also reported that 2.01 lakh projects had been completed. These figures are a dated national snapshot, not a current total for every district. Each number answers a different question. Collections show how much money has entered the system. Sanctions indicate the amount approved for projects. Releases show how much has been transferred to implementing agencies, while expenditure records indicate reported spending. Completion records show whether a project has been declared finished. None of these figures, on its own, proves that a service is working or that the intended beneficiaries are receiving it. For example, a sanctioned water-supply scheme may still be awaiting construction. A completed facility may lack electricity, staff, maintenance or a dependable water source. A livelihood programme may report participants trained without showing whether they secured sustained income. The investigation must therefore distinguish money approved, money released, money spent, work completed and outcomes achieved. Why Keonjhar is the starting point Keonjhar has a public-facing DMF website with project-level information, including project names, locations, sanctioned amounts, released amounts and status. Its records provide a starting point for matching financial documents with individual projects. The portal is a useful discovery tool, but its existence does not settle the accountability question. The reporting task is to test whether the information is sufficiently complete, current and consistent with supporting documents—and whether the projects listed can be verified on the ground. The first step is to select one project in a high-priority area, such as drinking water, healthcare, education or livelihoods. Its approval should be matched with the annual action plan, administrative sanction, tender, work order, release records, expenditure statements and completion certificate. Dates and amounts must be reconciled rather than assumed to match. The next step is physical verification. If the project is a water-supply scheme, for example, the investigation should check whether the infrastructure exists, whether water is available reliably, whether the equipment works and who can access the service. If it is a health or education project, the relevant checks may include operating hours, staffing, facilities and maintenance. This is where the difference between a project being built and a public service being delivered becomes visible. The accountability question is bigger than construction DMF spending can produce visible infrastructure, including roads, buildings and water pipelines. These may be necessary, but the presence of concrete structures does not establish that the spending has addressed the most urgent needs of mining-affected communities. In a 2025 assessment, iFOREST reported that DMFs had collected more than ₹1.03 lakh crore over their first decade and argued that weak planning, implementation and community participation were limiting their potential. Its analysis raised concerns about underutilised funds and investments that may not adequately address the needs of affected people. These are findings and arguments from an independent research organisation; they should be examined alongside district records and the government’s account. There are also questions about who decides which projects receive funding. The revised PMKKKY guidelines provide for Gram Sabhas and local bodies to contribute to planning, while requiring stronger monitoring and accountability measures. The investigation should establish whether affected communities had a meaningful role in identifying priorities, rather than simply being counted as beneficiaries after a project was selected. An official response may point to the number of projects approved, completed or funded. That information matters, but it must be tested against expenditure documents, the condition of the assets and evidence of who benefits. An independent expert may identify gaps in planning or participation, but such claims should also be checked against the relevant records. The purpose is not to assume that every project has failed—or that every official figure is misleading. It is to establish what the evidence supports. From public spending to public benefit The final assessment should follow one project from its financial approval to its actual use. Where records agree and the service functions, that should be reported clearly. Where money has been released but work remains incomplete, the ledger should show the gap. Where a project is marked complete but its functionality cannot be established, that distinction should remain visible. Missing records also matter. If a release order, expenditure statement or completion certificate cannot be found, the investigation should document the gap, ask the responsible authority for clarification and avoid treating an unanswered question as proof of wrongdoing. A district-level spending ledger can make this process repeatable. Each entry should include the project name, location, sector, sanctioned amount, amount released, reported expenditure, completion status, on-site functionality, beneficiary evidence, source documents and date of last verification. The wider lesson is straightforward: mining-affected communities should be able to see not only how much money their district receives, but also what that money delivers. A project list is useful; a verified account of spending, functioning services and community benefit is far more meaningful. The real measure of DMF money is not how much concrete a district can show. It is whether the people meant to benefit can rely on the services the money was supposed to provide. Sources: Ministry of Mines, Government of India — District Mineral Foundation and PMKKKY overview, including the revised 2024 guidelinesPress Information Bureau, Ministry of Mines — National DMF collection, sanction, expenditure and project figures up to November 2024DMF Keonjhar, Odisha — District Mineral Foundation portalDMF Keonjhar, Odisha — Phase-wise project details, including sanctions, releases and statusiFOREST — Assessment and discussion on the first decade of District Mineral FoundationsiFOREST — “A missed opportunity for social justice in mining regions” ...Read more

13 Oct 2026

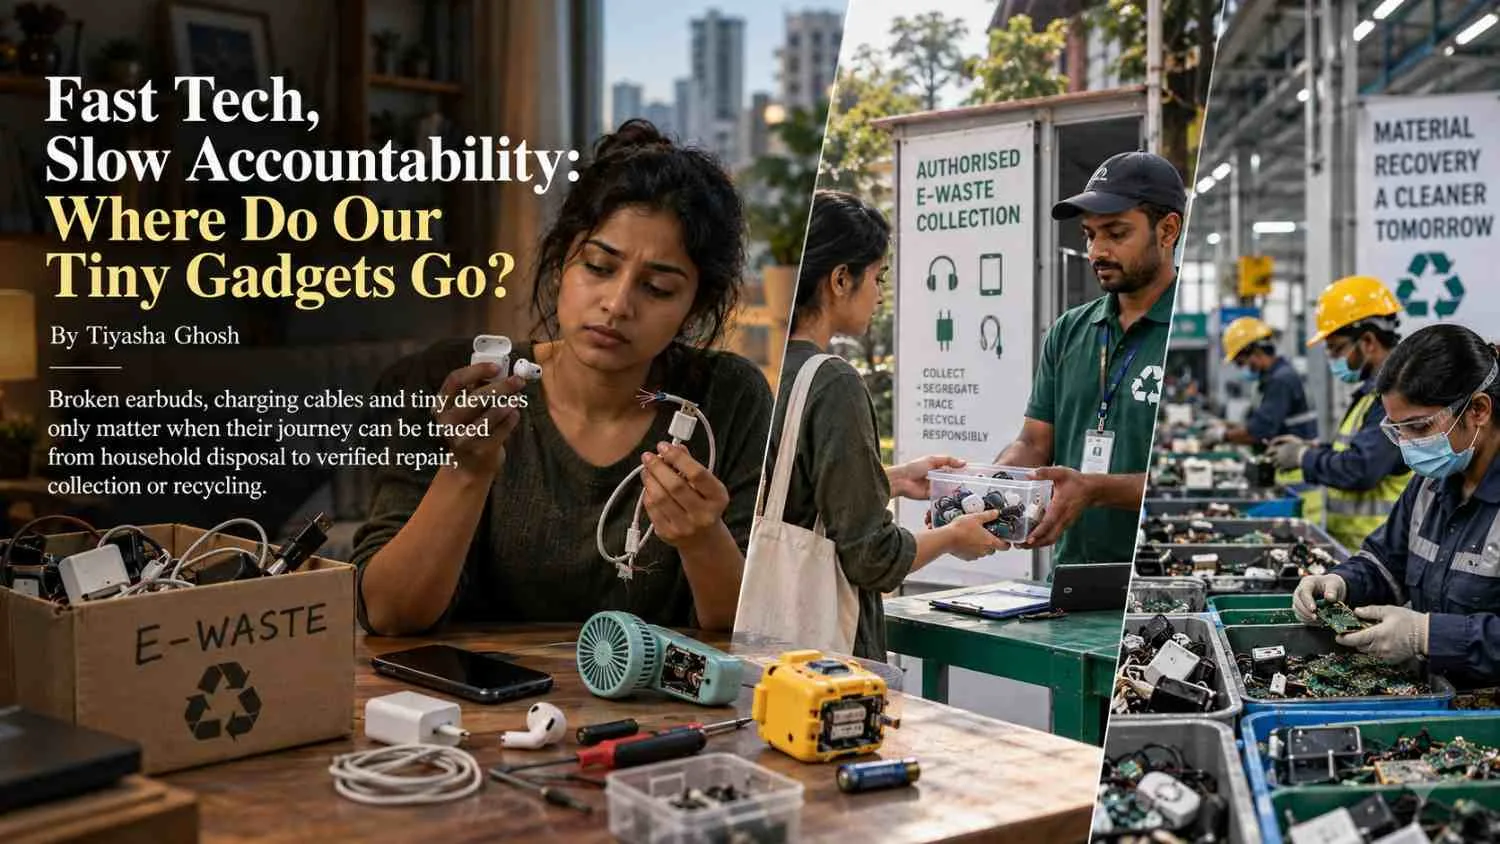
13 October 2026 | Kolkata Earbuds, charging cables and electronic toys are easy to replace. But when they stop working, their journey towards repair, collection or recycling is far less visible. Summary: Small electronic devices are an overlooked part of the e-waste problem. India has a formal e-waste management framework, but responsible disposal depends on accessible collection, accountable recycling and products that can be repaired. The real test is whether a discarded gadget can be traced from a household to its verified destination. If a Broken Earbud or Charging Cable Leaves Your Home, Can You Trace Where It Goes Next? A pair of earbuds stops working. A charging cable becomes unreliable. A small electronic toy breaks, or a mini fan is replaced by a newer model. These items are often too small to attract much attention, and their relatively low prices can make replacement seem easier than repair. Yet their size does not make them insignificant. Devices containing plugs, cables, circuit boards or batteries can become electronic waste when discarded. Some contain valuable materials that can be recovered, while others contain components that require careful handling. The problem is not simply how much electronic waste is generated. It is whether discarded devices enter a traceable system that can demonstrate what happens to them after they leave a household. The Global Numbers Reveal a Blind Spot The Global E-waste Monitor 2024, produced through the International Telecommunication Union and the United Nations Institute for Training and Research, estimated that the world generated 62 million tonnes of e-waste in 2022. Only 22.3% was documented as formally collected and recycled in an environmentally sound manner. Small equipment, including electronic toys and other household devices, accounted for 20.4 million tonnes, of which only 12% was documented as formally collected and recycled. India generated an estimated 4.137 million tonnes of e-waste in 2022, according to the Global E-waste Statistics Partnership. This is a historical estimate, not a measure of India’s current annual output or of the amount generated by small gadgets alone. These figures establish the scale of the problem, but they do not tell us how many earbuds or cables are collected in Kolkata, how much is processed locally or how much reaches its final destination. National estimates cannot substitute for evidence from a local collection chain. What Do India’s E-Waste Rules Require? India’s E-Waste (Management) Rules, 2022, which came into force on 1 April 2023, establish responsibilities for manufacturers, producers, refurbishers, dismantlers and recyclers handling electrical and electronic equipment covered by the rules. The framework includes extended producer responsibility (EPR), under which producers have specified obligations linked to e-waste management. The rules cover equipment listed in Schedule I and related components, parts and spares. Waste batteries are governed separately under the Battery Waste Management Rules, 2022. The Central Pollution Control Board operates an e-waste portal as part of the regulatory framework. Registration and compliance records provide an important starting point for checking whether an operator is authorised and what responsibilities apply to it. However, a regulatory framework does not prove that every household can conveniently return a small device. Nor does an authorised recycler’s stated annual capacity establish how much e-waste it actually receives or processes. Capacity, collection, processing and verified recovery are different measures. The key question is whether records connect these stages - and whether the information is accessible enough for consumers to make informed choices. Repair, Recycling and the Informal Sector Repair can extend a device’s useful life and delay the need for replacement. However, access to spare parts, repair information, compatible components and affordable services can influence whether a product is repaired or discarded. India’s Right to Repair portal, maintained by the Department of Consumer Affairs, provides information on warranty terms, spare parts, service details and repair options across several product categories. It is a useful consumer resource, but its existence does not guarantee that every component will be available or that every independent repair will be possible. There are competing concerns. Manufacturers and authorised service providers may emphasise product safety, quality control and the need for trained handling. Independent repairers and consumer advocates focus on affordability, access to parts and the ability to repair products without unnecessary restrictions. These concerns should be examined through actual repair costs, product policies and spare-part availability rather than assumptions about every company or repair shop. The collection stage raises another question. Informal collectors and dismantlers can help recover discarded materials and provide convenient collection services. However, where handling practices are unsafe or downstream destinations are unclear, both workers and the environment may face risks. The solution is not to overlook informal workers, but to improve safe working practices, traceability and access to accountable systems. From a Broken Gadget to Its Final Destination Tracing a discarded device means looking beyond the first collection point. A gadget may be repaired, reused, stored, handed to a collector or transferred to a recycling facility. Each route requires different evidence, and collection alone does not establish that materials have been recovered. The Afterlife of a Small Gadget What happens after your electronics stop working? StageWhat to checkRepairCan the gadget be repaired and used again?CollectionWas it handed over to an appropriate e-waste collection channel?ProcessingWhich recycler or other facility received it?Final destinationIs there evidence that it was properly processed, recycled or reused? The Accountability Gap A collection claim is not the same as proof of recycling. To trace a gadget’s journey, look for the receiver’s identity, a handover receipt, transfer records and evidence of its final destination. This is a reporting checklist, not a verified account of Kolkata’s current e-waste routes. A credible local audit should record the type and weight of items collected, the date and location of handover, the receiving operator’s identity, available receipts or transfer records, and any evidence of subsequent processing. This information would help distinguish between a collection drive that gathers devices, a facility capable of processing them and a system that can demonstrate actual recovery. A directory of collection points is useful only when locations, accepted items and operator details have been verified. What Can Consumers Do Now? The immediate steps are practical. Consider repair where feasible, keep discarded electronics out of ordinary household waste, and check with an appropriate authorised collection or recycling channel before handing them over. Devices containing lithium-ion batteries, including some wireless earbuds and small gadgets, should not be thrown into general waste. Damaged batteries can create fire risks during collection, transport and processing. Consumers can also check warranty conditions, ask whether spare parts are available and compare repair costs with replacement costs. These choices will not solve the e-waste problem alone, but they can help extend product life and reduce unnecessary disposal. The larger responsibility remains shared among producers, regulators, collection systems, repair businesses and recyclers. Each has a role in making repairs accessible, collection convenient and the final destination of discarded devices more transparent. The challenge is to make responsible disposal as convenient as buying a replacement. Small gadgets may be easy to overlook, but accountability should not disappear with them. A device’s journey should not end at the collection box; it should end with evidence of where it went and how it was handled. Sources: 1. WEEE Forum — International E-Waste Day 2026: “Fast Tech” Read the campaign brief 2. International Telecommunication Union — Global E-waste Monitor 2024 Read the report and key findings 3. Global E-waste Statistics Partnership — India, 2022 data View country statistics 4. Ministry of Environment, Forest and Climate Change — E-Waste (Management) Rules, 2022 Read the official rules (PDF) 5. Central Pollution Control Board — E-Waste Management System Visit the official portal 6. Department of Consumer Affairs — Right to Repair India Portal FAQs · About the initiative 7. Repair Café — International Repair Day, 17 October 2026 Read the announcement ...Read more

09 Oct 2026

9 October, 2026 | Kolkata Cotton is natural, familiar and widely used - but that does not automatically make every cotton shirt environmentally responsible. World Cotton Day highlights the need to look beyond sustainability labels and examine the water use, chemical management, farmer earnings, fabric quality and supply-chain transparency behind cotton clothing, especially when making festive purchases. SummaryIndia’s cotton industry supports farmers, textile workers and export businesses. But a shirt’s sustainability depends on more than its fibre label. Water availability, pesticide use, textile processing, durability, organic certification and the income farmers retain all matter. Following World Cotton Day on 7 October, the question is whether brands can prove their sustainability claims from the farm to the finished garment. If cotton is natural, what makes a cotton shirt sustainable? World Cotton Day, observed every year on 7 October, recognises cotton’s role in livelihoods, trade and the global textile industry. The 2026 observance highlighted the theme “Cotton for Good: Building Prosperity Through Trade, Transformation and Partnership”, placing economic opportunity and sustainability within the same conversation.  But the conversation should not end with celebrating cotton as a natural fibre. It should also ask how it is grown, how much water and how many chemicals are involved, whether farmers earn enough, and what happens when the fibre reaches textile factories. These questions matter when consumers begin buying clothes for Durga Puja, Deepawali and other festive occasions. A label may describe a shirt as cotton, organic or sustainably sourced, but each term tells us something different. None of them automatically proves that the entire garment has a low environmental footprint. The Food and Agriculture Organization (FAO) identifies cotton as an important source of income and employment for millions of smallholders and people across the textile value chain. Cotton also competes with fibres such as polyester, while manufacturers face pressure to control costs and meet buyers’ quality requirements. Sustainability therefore involves environmental protection, economic viability and the livelihoods of people who grow and process the crop.  The Hidden Water Cost of Your Cotton ShirtCotton is often criticised for its high water requirements, but its impact varies depending on where and how it is grown. Rain-fed cotton, irrigated cotton and cotton cultivated under different soil and weather conditions cannot be treated as though they have the same water footprint. A 2025 study of cotton production in central India examined water use, runoff and soil loss under rain-fed and drip-irrigated conditions between 2019 and 2022. The researchers reported that 51% of the average annual rainfall during the study period was lost through runoff. They estimated crop water use at 541 millimetres under rain-fed conditions and 624 millimetres under drip irrigation. The study also found that drip irrigation improved lint yield and reduced the calculated water footprint compared with the rain-fed system examined. These findings highlight why local conditions and the methods used to measure water consumption matter. However, they should not be treated as representative measurements for every cotton farm in Vidarbha. For this investigation, the reporting must trace the cotton back to where it was grown and establish whether the farm relied on rainfall, groundwater, canal water or another source. Farm records, irrigation details, local rainfall data and water-stress assessments can help provide this context. If a brand claims that its cotton uses less water, it should clearly explain the method, assessment boundary and comparison behind that claim. The investigation must also follow the material beyond the farm. Ginning separates cotton fibres from seeds, spinning turns the fibres into yarn, and weaving or knitting converts the yarn into fabric. Dyeing, washing and finishing can require additional water and chemicals. Therefore, lower water use during cultivation does not automatically mean that the finished shirt has a lower overall environmental footprint. Organic cotton: does certification tell the whole story? Organic certification can provide useful evidence about how cotton was grown under a defined standard. It helps buyers distinguish certified material from cotton for which an equivalent claim has not been demonstrated. India has a voluntary Standard for Chain of Custody for Indian Organic Fibres and Products, introduced under the National Programme for Organic Production. The system sets requirements for certified fibre, processing, handling and documentation, including transaction certificates for consignments moving through different processing units. It is designed to help maintain the integrity of organic material as it moves through the supply chain.  However, certification should not be treated as proof of every environmental benefit a brand might claim. A certificate does not automatically establish the water footprint of a finished shirt, the full chemical profile of its processing, its durability or the income received by the farmer. A 2025 systematic review of 20 cotton life-cycle assessment studies highlights why the distinction matters. The review found that organic cotton farming could have lower environmental impacts per unit of cultivated area, but higher impacts per unit of cotton mass in some comparisons, partly because organic systems may produce lower yields. The result depends on the measurement unit, farming conditions and impact being assessed. The review also identifies processing and consumer care, including washing and drying, as important parts of the wider lifecycle.  This does not mean organic cotton is inherently worse or that certification is unhelpful. It means that a single label cannot answer every question. Certification specialists may argue that standards and audits provide a practical foundation for accountability. Brands may point to certification as a way to manage complex supply chains. But maintaining records and separate material flows can involve costs, particularly for smaller suppliers. The reporting should examine what certification proves, what it leaves unmeasured and whether its requirements are practical for farmers and businesses. The key question is whether the claim on the garment is supported by the relevant records - and whether the brand explains the limits of that claim. Pesticides and farmer income: who bears the cost of cotton? Cotton farmers must manage pests, weeds, unpredictable weather and production costs. Their decisions are shaped by available advice, labour, seeds, inputs and reliable buyers. Reporting on pesticide use must recognise these pressures rather than treating farmers as the sole cause of environmental harm. Pesticide use can create risks for farm workers, nearby communities, soil and water when products are applied or handled improperly. Yet pesticide runoff at a particular location must be established through appropriate sampling and testing, not inferred from the mere presence of cotton cultivation. Research offers evidence that alternative approaches can be worth examining. A field study conducted during the 2022–2024 rainy seasons in Khandwa district, Madhya Pradesh, evaluated integrated pest management in Bt cotton. It reported a 46.55% reduction in pesticide sprays, a 25.38% increase in seed-cotton yield and net returns more than 56% higher than under the farmers’ usual practices. The findings support further investigation of integrated pest management, but they do not establish that the same outcomes have already been achieved across Vidarbha.  For farmers, however, the question is not simply whether a method is environmentally preferable. It must also be practical and financially viable. An alternative may require new equipment, training, additional labour or different timing. Farmers need to know whether the expected benefits outweigh those costs and whether buyers will reward the effort. This is why farmer net returns deserve particular attention. A higher selling price does not necessarily mean a higher profit. Seed, fertiliser, pesticide, irrigation, labour, transport, interest and other costs affect what remains after harvest. The investigation should compare production costs with sale receipts and, where possible, payments under procurement arrangements. It should ask whether certified cotton earns a premium, whether that premium reaches the farmer after intermediary costs, and whether growers face additional expenses to meet sourcing requirements. A brand may describe its sourcing as responsible, but the claim means little economically if the farmer cannot demonstrate a fair or reliable return. Equally, a sourcing programme should not be dismissed simply because it has documentation costs. The relevant question is whether the arrangement provides verifiable environmental and livelihood benefits, and who bears the cost of achieving them. From Vidarbha to the export house Cotton may pass through several businesses before it becomes a shirt. It can be sold to a ginner, processed into fibre, spun into yarn, woven or knitted into fabric, dyed and finished, cut and stitched into a garment, and then supplied to a retailer or export house. At each stage, material may be combined, processed or transferred to another operator. This makes chain-of-custody evidence central to claims that a garment contains cotton from a particular farm, region or certified source. India’s Kasturi Cotton Bharat programme is one example of an effort to strengthen traceability and certification. A Ministry of Textiles backgrounder reported that, as of 30 June 2026, 3,29,550 bales had been certified under the programme and 116 units had renewed registration. The initiative describes QR-based certification and blockchain technology as part of its traceability approach. These figures show activity within the programme; they do not prove that any particular retail shirt contains cotton from a named farm. Product-level claims require product-level evidence.  For this story, the evidence trail should connect the farm or producer group to the ginner, spinner, fabric maker, processor, garment manufacturer and exporter. Purchase orders, invoices, batch identifiers, processing records, certification documents and transaction records can help establish whether the material remained traceable through these stages. It is also important to distinguish physical traceability from systems that reconcile certified inputs and outputs through records. A company must explain which system it uses and what that system proves. A certificate may establish compliance with a particular standard, but it should not be presented as proof of every environmental or social benefit. Different stakeholders may judge the same sourcing system differently. Exporters may prioritise consistent quality, timely delivery and competitive pricing. Weavers may focus on yarn quality, fabric performance and reliable supply. Farmers may be concerned with crop risks, production costs and the price received. Certification specialists may emphasise standards, documentation and auditability. These priorities can overlap, but they can also conflict. Stronger traceability may improve accountability while increasing administrative costs. A sustainability premium may help farmers, but only if it is passed through transparently. A certified material may satisfy a buyer’s sourcing requirements without establishing that every stage of processing has a lower environmental impact. The reporting should test these competing perspectives against documents and evidence rather than assuming that either a certificate or a criticism settles the question. Blends, Durability and the Clothes We Keep The fibre content of a shirt is another important part of its sustainability profile. A garment marketed as cotton may contain a blend of different fibres, making its exact composition important. Blended fabrics can offer practical benefits, including stretch, better shape retention and reduced creasing. However, their environmental impact depends on the materials used, how the garment is constructed, how long it lasts, how it must be cared for and what options are available when it reaches the end of its useful life. Cotton is not automatically the best choice for every purpose, just as a synthetic blend is not automatically the worst. A meaningful comparison must consider what the garment is designed to do, how long it is likely to last, how frequently it will be worn and what happens when it is no longer usable. Durability deserves greater attention during festive shopping. A shirt that is worn repeatedly and repaired when needed may offer better value than one that loses its shape, tears or is discarded after only a few uses. However, durability claims should also be examined rather than accepted at face value. Fabric specifications, seam strength, shrinkage, colourfastness, care instructions and repair options can all help indicate how well a garment is likely to last. The same scrutiny should apply to claims about recycled content or easy recyclability. A fabric’s composition can determine how easily its fibres can be separated and recovered. Consumers should not assume that a blended garment can be recycled simply because one of its materials is recyclable on its own. The wider life cycle matters too. A garment’s environmental footprint extends beyond cotton cultivation. Processing, manufacturing, transport, washing, drying, repair and disposal all contribute to its overall impact. A 2025 systematic review of cotton life-cycle assessments highlights the importance of examining these stages together rather than judging sustainability by the raw material alone. What Should Shoppers Ask Before Buying Festive Clothes? Consumers cannot inspect an entire supply chain while shopping, but they can ask more informed questions: What is the exact fibre composition? Check whether the garment is made from pure cotton or a blend of different fibres.Is the organic or sustainability claim certified? Look for a valid certificate and understand what it actually covers.Can the brand explain its sourcing? Ask whether the cotton can be traced from the farm to the finished garment.What is known about water and chemical management? Look for specific evidence rather than broad environmental promises.Is the garment built to last? Consider the fabric quality, stitching, care instructions and availability of repair options.Does the company explain the returns to farmers? Responsible-sourcing claims should not overlook the economic realities faced by growers.What happens when the garment is no longer usable? Check whether repair, reuse or recycling options are realistically available. Brands should explain the scope of their sustainability claims in clear, accessible language. Where supporting evidence is unavailable, that limitation should be acknowledged rather than concealed behind terms such as “green”, “natural” or “conscious”. For businesses, stronger traceability can be more than a compliance exercise. Reliable records can help identify supply-chain risks, respond to buyer requirements and distinguish documented performance from marketing claims. However, the cost of certification and documentation also matters. A credible sourcing model should consider whether smaller farmers and suppliers can participate without facing a disproportionate financial or administrative burden. Following World Cotton Day, the central lesson is clear: cotton may be natural, but its sustainability must be demonstrated. It depends on how the crop is grown, how farmers and workers are treated, how the material is processed, how long the garment lasts and whether its environmental claims can be verified. The next time a shirt carries a sustainability label, the most useful question is not simply what the label says. It is what evidence stands behind it.Sources FAO — Cotton: Markets and Trade. Background on cotton’s role in livelihoods, employment, trade and competition with other fibres. https://www.fao.org/markets-and-trade/commodities-overview/fibres/enFAO — World Cotton Day, 7 October. Background on the annual observance and the 2026 theme, Cotton for Good: Building Prosperity Through Trade, Transformation and Partnership. https://www.fao.org/world-cotton-day/world-cotton-day-7-october/3/enAPEDA / National Programme for Organic Production — Chain of Custody for Indian Organic Fibres and Products. Requirements for certified organic fibre and supply-chain documentation. https://npop.apeda.gov.in/sites/default/files/announcements/Notifications_organic_textiles_1402202011032020.pdfVitale et al., Journal of Agriculture and Food Research (2025) — “Environmental sustainability of cotton: a systematic literature review of life cycle assessments.” Review of environmental impacts across cotton cultivation, processing and use. https://doi.org/10.1016/j.jafr.2025.102069Bhargavi, Blaise and Nalayini, Cleaner Water (2025) — “Water footprint, runoff and soil loss assessment of cotton production in central India.” Study of rain-fed and drip-irrigated cotton under the conditions examined. https://www.sciencedirect.com/science/article/pii/S2950263225000572Kumar et al., The Indian Journal of Agricultural Sciences — “Field validation of integrated pest management strategy in Bt cotton under farmers’ participatory mode in central India.” Study of integrated pest management in Khandwa, Madhya Pradesh, during the 2022–2024 rainy seasons. https://epubs.icar.org.in/index.php/IJAgS/article/view/168748Press Information Bureau, Ministry of Textiles (2026) — Kasturi Cotton Bharat programme background. Programme information and certification figures reported as of 30 June 2026. https://www.pib.gov.in/PressReleasePage.aspx?PRID=2286497 ...Read more

07 Oct 2026

AI is accelerating the world's appetite for computing. But behind every new server, GPU, laptop and smartphone lies a material chain of metals, energy, labour and waste that rarely appears in the AI conversation. The Big QuestionCan the AI Economy Become More Productive Without Making the Electronics Economy More Disposable? Artificial intelligence is usually discussed as a story of algorithms, models and computing power. But every AI system ultimately depends on physical infrastructure: processors, GPUs, memory, storage, networking equipment, servers and the devices through which users access these services. As AI workloads expand and hardware generations change faster, the sustainability question is moving beyond how much electricity these systems consume. It is increasingly becoming a question of what happens to the machines that are replaced. That matters because the electronics waste problem already exists at an enormous scale. India generated an estimated 1.40 million tonnes of e-waste in 2024–25, up from about 1.25 million tonnes the previous year, according to CPCB estimates cited by the Government of India. The reported share collected, dismantled and recycled or disposed of also increased from 61.94% to 70.71%. These figures, however, are based on sales data from registered producers and the estimated average life of covered equipment. They do not represent a complete account of every device entering India’s formal and informal waste streams. Globally, the scale is even larger. The UN’s Global E-waste Monitor 2024 estimated that the world generated 62 million tonnes of e-waste in 2022, while only 22.3% was documented as formally collected and recycled. If current trends continue, global e-waste could reach 82 million tonnes by 2030. AI is entering this already expanding system. Follow One Machine, Not an Abstract Tonne The easiest way to understand the problem is not to begin with millions of tonnes. It is to follow one machine through its entire lifecycle. Consider a laptop purchased by a school or a small business. It is procured, assigned to a user, maintained and eventually upgraded. Over time, its battery begins to deteriorate. Its processor may no longer be capable of handling newer software. Its memory may be expandable - or it may not be. Eventually, a newer device enters the procurement cycle and the old machine is declared obsolete. At that point, however, its environmental story has only just begun. Is it repaired? Is it transferred to another employee or student? Is it sold to a refurbisher? Is its data securely erased before resale? Does the organisation maintain a record of where the device goes? If it cannot be reused, does it reach a registered recycler? And even if it does, can the material be traced beyond that first handover? The same sequence exists inside a data centre, although the equipment and scale are radically different. A server or accelerator system can become economically unattractive long before every component has physically failed.    THE LIFE OF ONE MACHINEProcurement → Use → Upgrade → Repair → Secure data wipe → Resale/refurbishment → Dismantling → Recycling → Final material destination. This is where AI changes the conversation. The rapid evolution of computing architectures can create pressure for faster hardware turnover. Research published in Nature Computational Science estimated that generative AI-related e-waste could accumulate to 1.2–5.0 million tonnes between 2020 and 2030 under different development scenarios. The study identifies rapid server turnover and operational cost considerations as factors that could intensify the waste stream, while also finding that circular-economy interventions could significantly reduce it. That figure is a modelled scenario, not a measurement of future waste. It should therefore not be reduced to the simplistic claim that AI will produce five million tonnes of e-waste. The more useful question is what happens to the hardware chain when demand for computing accelerates. The Replacement Problem Replacing older technology is not automatically environmentally irresponsible. Newer hardware can deliver substantially greater computing capacity and, in some cases, improved energy efficiency. Keeping inefficient equipment in operation indefinitely is not necessarily the greener choice. The real question is whether the environmental benefits of new equipment justify the material and waste consequences of replacing hardware more frequently. Answering that requires looking beyond a single metric and considering the full life cycle of the equipment. A new server may consume less electricity per unit of computation. But manufacturing it still requires raw materials, components, energy and complex global supply chains. And when the old server leaves the data centre, it does not simply disappear. It may be refurbished, resold, dismantled, recycled or exported. The environmental cost of manufacturing that equipment does not vanish simply because its accounting value has fallen to zero. This is why hardware life needs to become part of the AI sustainability conversation. The Material Hidden Inside the Machine The word “cloud” makes computing sound almost weightless. The hardware that powers it is anything but. Electronic equipment contains metals, plastics, circuit boards, batteries and other components. Some contain valuable materials that can be recovered, while others may contain substances that pose environmental and health risks when handled improperly. India’s e-waste framework therefore treats collection, refurbishment, dismantling and recycling as regulated activities rather than leaving discarded equipment to an undefined waste market. This creates an important contradiction. An obsolete device can simultaneously be waste, a security risk, a source of recoverable materials and a functioning product with potential second-life value. What it ultimately becomes depends on the system around it. A laptop that is repaired and used for another three years follows a fundamentally different environmental pathway from one that is dismantled immediately for material recovery. Recycling is essential, but preserving the value of a functioning product represents a different form of circularity from breaking that product down into materials. That makes repair and reuse the first tests of a genuinely circular AI hardware economy. The School and SME Test The difference becomes particularly visible outside large technology companies. A major corporation or data-centre operator can negotiate procurement contracts, maintenance arrangements, take-back programmes and asset-disposition services at scale. A small business or school often cannot. For a school operating under tight budgets, replacing an ageing laptop may appear easier than paying for diagnostics, spare parts and repairs. For a small business, the cost of repair can approach the machine’s remaining economic value. If replacement is cheaper and faster, an old device can begin its journey towards the waste stream even when it still contains useful components or could serve another user. This is where the sustainability conversation has to move beyond blaming consumers. The more relevant question is what the system makes economically rational. If repairs are expensive, spare parts are difficult to access, software support ends early and replacement devices are readily available, disposal can become the predictable outcome of an otherwise ordinary purchasing decision. Data Security Can Complicate Circularity There is another reason perfectly usable electronics may never reach a second life: data. Corporate laptops and servers can contain confidential information, customer records, intellectual property and other sensitive material. An organisation therefore cannot simply hand a discarded machine to a reseller and assume that reuse automatically follows. Secure data erasure becomes a critical link between disposal and circularity. The challenge is whether an organisation can demonstrate that sensitive information has been securely removed while keeping the physical machine reusable. If destruction is chosen simply because it offers an easier way to guarantee that data cannot be recovered, security procedures can unintentionally work against the circular economy. An effective asset-disposition process should therefore be able to answer two questions at the same time: Was the data securely erased? And was the hardware given the longest feasible useful life? From Refurbisher to Recycler When a machine remains functional, refurbishment can preserve considerably more of its value than dismantling it. India’s regulatory framework recognises refurbishment as part of the e-waste system, with registered producers, recyclers and refurbishers operating through the CPCB’s EPR framework. CPCB also requires recyclers to maintain records of e-waste collected, dismantled, recycled and transferred to other registered recyclers, making documentation an important part of the formal chain. But once reuse is no longer viable, dismantling becomes unavoidable. That is where the material value of electronics becomes important. Metals and other recoverable components can return to productive use rather than being lost through dumping or poorly controlled processing. Yet the existence of an EPR certificate or a recycling claim does not, by itself, reveal the complete physical journey of an individual device. A responsible investigation therefore has to follow the chain further. Who received the equipment? How much did they receive? What weight entered the recycling facility? What materials were recovered? Which downstream recycler handled the fractions the first facility could not process? Were batteries treated separately? Where did the recovered material eventually go? And if material crossed a national border, what happened after export? The Worker Cannot Disappear from the Story There is also a labour system behind every tonne of e-waste. Someone dismantles the machine. Someone separates its components. Someone handles batteries and circuit boards. Someone works around dust, sharp components and potentially hazardous substances. That is why e-waste cannot be assessed only through recycling rates. A system that reports impressive material recovery while shifting health risks onto poorly protected workers cannot be considered fully circular. CPCB’s environmentally sound recycling guidelines specify occupational and environmental controls for recycling and refurbishment facilities, including dust control, ventilation and the management of hazardous fractions. The question, therefore, is not simply: “Was this device recycled?” It is: “Was it recycled safely, and can that be demonstrated?” The Global Problem Is Bigger Than AI It is important not to turn AI into the sole explanation for the e-waste crisis. The global e-waste problem predates generative AI and is driven by broader patterns of consumption, shorter technology cycles, rising device ownership and inadequate collection and recycling systems. The Global E-waste Monitor shows how far the existing system remains from a genuinely circular model. AI is better understood as a potential accelerator. More computing can mean greater demand for specialised hardware. More specialised hardware can create greater pressure for upgrades. Faster upgrades can shorten the effective lifetime of equipment. And shorter equipment lifetimes can increase the volume of devices entering repair, resale, refurbishment and recycling systems. The question is whether those downstream systems can scale quickly enough to keep pace. One AI Prompt, One Material Chain This is where the sustainability discussion needs to become more precise. It is tempting to calculate the environmental impact of a single AI prompt and assign it a neat number of grams of e-waste. But there is no universal figure that can responsibly be applied to every prompt. The hardware involved, the model being used, the workload, server utilisation, equipment lifetime, allocation of embodied impacts and several other factors can change the result. A more useful way to understand the issue is to follow the physical chain: ONE AI PROMPT → COMPUTE DEMAND → GPU/CPU → MEMORY & STORAGE → SERVER CAPACITY → DATA-CENTRE HARDWARE → UPGRADE/REPLACEMENT → REUSE OR DISMANTLING → MATERIAL RECOVERY The prompt is digital. The chain is physical. And that is the material story of AI that often remains hidden behind the cloud. ONE AI PROMPT → ONE MATERIAL CHAINAI prompt → compute → GPU/CPU → server → data centre → upgrade → repair/reuse → recycling → material recovery.Do not assign a fabricated e-waste figure to a single prompt. What Would a Genuinely Circular AI Hardware System Look Like? A genuinely circular AI hardware system would begin before the equipment is purchased. A company should know the expected lifespan of its servers and devices, whether components can be upgraded, how easily spare parts can be sourced, how the equipment will be maintained and what will happen when it reaches the end of its useful life. When equipment is replaced, the organisation should also be able to document why the replacement was necessary. The next question is what happens before a machine becomes waste. Was repair considered? Was the data securely erased? Could the equipment be transferred to another user, refurbished or otherwise given a second life? If it was no longer usable, did it enter an authorised recycling chain? The process should not end when the equipment is collected. A genuinely circular system should be able to demonstrate where the machine went, what happened to it and what was recovered from it. That means asset registers, replacement policies, secure-erasure certificates, refurbishment records, EPR documentation, weight tickets, recycler details, worker-protection evidence and downstream material trails should not be treated as routine paperwork completed after the fact. They are the evidence that allows a circularity claim to be tested. If the chain cannot be documented, the circularity cannot simply be assumed.    THE CIRCULARITY TEST LAST LONGER → REPAIR → REUSE → RECYCLE → TRACE A device passes the circularity test only when its journey can be documented across the chain. The Evidence Trail The final test is not whether a company can say that it “recycles responsibly.” It is whether the organisation can prove what happened to its equipment after it was replaced. For every corporate or institutional case, the reporting should seek the asset register, replacement policy, repair records, secure-erasure certificates, resale or refurbishment records, EPR documentation, weight tickets, recycler details, worker-protection evidence and downstream material trail. Together, these records can establish whether a device was actually repaired, whether it was given a second life, whether its data was securely erased, how much material reached a recycler and what happened to that material afterwards. If equipment or recovered material was exported, the investigation should follow the trail as far as the available documentation allows. If the chain ends at the first recycler, that limitation should be reported rather than filled with assumptions. Because in a circular economy, the evidence trail is not a supporting detail. It is the proof that the circle was actually completed. THE E-WASTE ACCOUNTABILITY LEDGER StageWhat must be provedProcurementAsset registerReplacementDisposal/replacement policyData securitySecure-erasure certificateReuseResale/refurbishment recordEPREPR documentationRecyclingWeight ticketDismantlingRegistered downstream entityLabourWorker-protection evidenceExportCustoms/downstream trail THE REAL TEST The future of AI will be measured by computing power, productivity, energy use, water consumption and economic value. But one measure must not remain outside the frame: how long its hardware lasts before it becomes waste. That answer will determine whether AI deepens the world’s e-waste crisis—or helps build a more circular, traceable and responsible electronics economy. AI does not need to stop advancing. But the physical infrastructure powering that progress can no longer remain invisible. Because the real sustainability test of AI is not simply how much intelligence we can generate from machines, but how responsibly we design, use, repair, reuse and finally dismantle the machines that make that intelligence possible. If AI is shaping the future, its hardware must not become the waste of that future. Primary Sources Central Pollution Control Board — E-Waste Management Rules / FAQ[https://cpcb.nic.in/uploads/Projects/E-Waste/FAQ_ewaste_23012024.pdf]Government of India / PIB — National E-Waste Generation and Recycling Data[https://www.pib.gov.in/PressReleasePage.aspx?PRID=2147876&lang=2&reg=48]CPCB — E-Waste Management / EPR Framework[https://cpcb.nic.in/e-waste/]CPCB — Environmentally Sound Management of E-Waste[https://cpcb.nic.in/uploads/Projects/E-Waste/Guidelines_Environmentally_Sound_Recycling_E-Waste.pdf]UN / UNITAR / ITU — Global E-waste Monitor 2024[https://ewastemonitor.info/the-global-e-waste-monitor-2024/]Nature Computational Science — E-Waste Challenges of Generative AI[https://www.nature.com/articles/s43588-024-00712-6]  ...Read more

06 Oct 2026

6 October, 2026 | Kolkata India wants to turn crop residue from a seasonal pollution problem into a rural fuel economy. But the real test begins after harvest: who collects the straw, who pays the farmer, who bears the transport cost, and what happens to the soil when the residue leaves the field? SummaryIndia already has hundreds of Compressed Biogas (CBG) projects either operational or under development, while government policy is gradually pushing biomethane into the transport and gas ecosystem. But crop residue is not an ordinary raw material. It is available only during a short harvest window, varies in moisture and quality, can be costly to collect and transport, and plays an important role in maintaining soil health.This makes the economics of CBG more complicated than simply building more plants. The success of India’s CBG economy will depend on whether farmers can reliably move crop residue from fields to processing plants at a cost that works for farmers, aggregators and plant operators alike - without creating new environmental costs in the process.The real question, therefore, is not how many CBG plants India can announce or build but whether India can make crop residue economically valuable without making its removal financially or ecologically costly. Can India’s Crop-Residue Economy Work at the Farmgate, Not Just at the Plant Gate? After the paddy harvest, the clock starts ticking. A farmer in Punjab or Haryana may have only a narrow window before the next crop has to be planted. The straw left behind is bulky, difficult to handle and expensive to move. Burning remains attractive precisely because it offers a fast solution to a time-sensitive problem. That is what makes Compressed Biogas (CBG) such an interesting proposition. Instead of treating paddy straw as something to dispose of, a CBG plant can treat it as a feedstock. Straw is collected, baled, transported and processed through anaerobic digestion. The resulting biogas is upgraded into biomethane and compressed for use as fuel, while the process can also generate organic manure. On paper, it is an elegant circular-economy story. But the field is much less tidy. The straw has to reach the plant on time and meet quality requirements. Trucks have to travel. Bales have to be stored. Farmers and aggregators need to be paid or compensated. The plant needs to remain operational. The gas needs a reliable buyer. Digestate needs to meet applicable standards and find a credible agricultural use. And all of this has to happen within a highly compressed agricultural season. That is the farmgate test. India’s CBG Sector Is Moving Beyond the Pilot Stage India’s policy architecture is no longer treating CBG as an experimental fuel. The Sustainable Alternative Towards Affordable Transportation (SATAT) initiative was launched in 2018 to build an ecosystem for producing CBG from waste and biomass. Oil and gas marketing companies including IOCL, BPCL, HPCL, GAIL and IGL have been inviting producers to supply CBG, while the government says long-term offtake agreements at assured prices are being executed. The policy push is becoming stronger as well. India’s CBG blending obligation has entered its mandatory phase, with a requirement of 3% for FY2026–27, rising to 4% in FY2027–28 and 5% from FY2028–29. As of 27 January 2026, the GOBARdhan portal reported 189 functional CBG projects across India. Uttar Pradesh had 37, Gujarat 25, Haryana 20, Karnataka 20, Maharashtra 20 and Punjab 10. That points to a rapidly emerging industry. But there is an important distinction: A functional CBG plant is not automatically a successful crop-residue supply chain. A plant can have the technology, an offtake agreement and the ability to produce gas. The harder question is whether it can secure enough suitable biomass, at a workable cost, year after year. THE SEASONAL RESIDUE FLOW Create a horizontal seasonal flow: Paddy harvest → Straw collection → Baling → Village aggregation → Storage → Transport → CBG plant → Biomethane → OMC/fuel buyer Under each stage, show the potential friction point: 15 –20 day harvest window | Moisture | Quality | Farmer payment | Storage loss | Transport cost | Downtime | Methane loss | Offtake Crop residue is a moving, seasonal supply chain - not a static national tonnage figure. Punjab Shows Both the Promise and the Problem Punjab is a natural laboratory for this question. The state has been promoting both in-situ and ex-situ crop-residue management. ICAR reported in September 2026 that Punjab has around 31.76 lakh hectares under paddy and nearly 20 million tonnes of straw generation, while stakeholders have been calling for stronger biomass aggregation, transportation, storage and assured offtake. That discussion reveals where the challenge is moving. The question is no longer simply how to convince farmers not to burn residue. It is how to build a system capable of handling the material once it is removed from the field. Punjab Energy Development Agency currently lists 57 allocated CBG projects, with a combined capacity of about 815.68 tonnes per day, based on paddy straw and other agricultural residues. Six projects, totalling around 107.48 tonnes per day, are operational, while another five projects with a combined capacity of 37.5 TPD are expected to become operational during FY2026–27. That immediately raises a larger question: Where will all the straw come from? Following the Straw to Lehragaga One of the most useful case studies is the Verbio biorefinery at Lehragaga in Sangrur district, Punjab. The plant began producing biomethane from agricultural residues in 2022. The company says the facility was designed to process around 100,000 tonnes of agricultural residue annually, with BioCNG production capacity of up to 33 tonnes per day, alongside large-scale production of humus fertiliser. Its gas is supplied into IndianOil’s retail network in Punjab. This is precisely the kind of plant the investigation should follow. Not because it should automatically be presented as a success story, but because it allows the reporting to examine the entire chain. Where does the straw come from? How far does it travel? Who aggregates it? What does the farmer actually receive? Is the farmer paid for the straw, or does the economic benefit primarily come from free collection? How much does baling cost? What happens when the straw is wet? What happens when the plant needs more feedstock than nearby farms can provide? What happens when the plant is not operating? And what happens to the material that comes out at the other end? Verbio has described its model as providing farmers with free straw collection while creating rural economic value. That is useful evidence. But “free collection” is not the same as a measured increase in farmer income. The reporting therefore needs the actual ledger. The Farmer’s Income Cannot Disappear Behind the Word “Waste” This is where the CBG story needs greater precision. Crop residue is often described as waste. For the farmer, however, it is not necessarily worthless. Depending on the farming system, residue can be incorporated into the soil, used for livestock-related purposes, sold into biomass-energy or industrial markets, or directed towards other value chains. In some cases, it may also represent a cost rather than an income opportunity. The relevant economic question is therefore not: “How much does a tonne of straw cost?” It is: “What is the farmer’s net position after the residue leaves the field?” That calculation should account for: payment received for residue, if any;baling and handling arrangements;transport responsibility;time saved;machinery costs avoided;alternative value of the straw;impact on field preparation;possible soil-nutrient replacement costs;and the reliability and timing of payment. A farmer receiving ₹X per tonne is not necessarily better off if removing the straw creates ₹Y of additional costs elsewhere. The article should therefore avoid using a headline straw price as a proxy for rural prosperity. FARMER NET-INCOME CARD FARMER NET OUTCOME Straw payment+Collection / handling savings+Avoided field-management cost−Transport or other deductions−Nutrient / soil-management cost=NET FARMER VALUE Use actual numbers from one documented farmer or FPO account. Do not present a modelled figure as observed farmer income. The Soil Cannot Become the Invisible Stakeholder There is another side to removing residue from the field. ICAR’s recent crop-residue work continues to emphasise in-situ management, including the incorporation of straw into soil. Its field programmes have highlighted potential benefits related to soil organic carbon, fertility, water conservation and nutrient retention. That creates a genuine competing viewpoint. One argument says: Take the residue away and turn it into fuel. The other says: Not all residue should be removed because some of it belongs in the soil. The article should not automatically choose one side. The more useful question is: How much residue can be sustainably removed from a particular farming system without undermining soil health? That answer will not be identical everywhere. Soil type, crop rotation, irrigation, organic-carbon levels, residue quantity, local machinery and competing uses can all influence the answer. A CBG plant therefore cannot simply define its feedstock requirement and assume surrounding fields can sustainably supply it. The field has an ecological budget too. The Logistics Problem Starts Long Before the Plant A bale of straw is not a pipeline commodity. It has to be collected from scattered farms and moved to aggregation points before reaching the plant. That creates a collection-radius problem. The farther a plant has to travel for its feedstock, the more complicated the economics become. The physical chain may look like: Field → Baler → Tractor/trailer → Aggregation point → Storage → Truck → Plant Every additional movement consumes time, fuel and money. There is also a seasonal mismatch. The plant may need feedstock throughout the year, while farms produce most of their straw within a narrow harvest window. Storage therefore becomes part of the business model. The investigation should seek: daily weighbridge records;bale counts;source-village records;average collection distance;storage duration;rejected loads;moisture readings;quality specifications;transport bills;and plant feedstock inventories. If those records cannot be provided, that absence is itself relevant evidence. Moisture Can Decide Whether the Economics Work Biomass is not uniform. Moisture affects its weight, storage behaviour and usable energy content. Poorly managed biomass can deteriorate during storage and create operational problems. That means two farmers delivering apparently similar bales may not be delivering the same usable feedstock. This makes moisture and quality rejection central to the investigation, not minor technical details. The plant’s contract should establish: What moisture level is acceptable?What happens when a load exceeds it?Is the farmer penalised?Is the aggregator penalised?Who pays for rejected material?Is the material returned?How frequently does rejection occur?How is moisture measured? A feedstock contract that looks attractive on paper can behave very differently once quality deductions enter the calculation. The Gas Is Only Half the Story CBG is not the end of the process. The plant also produces digestate or organic manure, creating the possibility of another circular-economy loop. Residue enters as agricultural feedstock. Gas leaves as fuel. Digestate can potentially return to agriculture. But that loop only works if the digestate is safe, compliant, usable and actually accepted by farmers. A previously reported case at the Lehragaga plant highlighted moisture-related concerns around manure specifications, showing why the by-product can become a commercial and regulatory issue rather than an automatic benefit. The investigation should therefore seek digestate analysis, not simply photographs of manure being loaded onto tractors. It should examine: moisture;nutrient content;contaminants;compliance with applicable standards;storage;farmer uptake;price;and actual field application. The circular-economy claim is incomplete if the digestate has nowhere credible to go. Methane Leakage Is the Other Side of the Climate Claim CBG can only deliver its intended climate benefit if the entire system performs properly. Methane is the product being captured and sold. It is also a powerful greenhouse gas if it escapes before capture, during processing, storage or upgrading. That makes methane leakage one of the most important evidence gaps in the story. A production number tells us how much methane became a commercial product. It does not automatically tell us how much methane escaped. The investigation should therefore ask for: Leak-detection methods, testing frequency, maintenance records, fugitive-emission data and corrective-action logs. If methane-leak testing is unavailable, the article should say so. Missing measurement should never be replaced with a generic claim that biogas is “clean”. The climate claim needs a boundary, a baseline and a measurement method. The Buyer Matters as Much as the Farmer The CBG business does not end when gas leaves the plant. Someone has to buy it. SATAT provides a potential route through oil and gas marketing companies, while the CBG blending obligation creates a growing policy-driven demand signal. But the reporting should still establish: Who is the actual buyer? What does the contract guarantee? What happens when production falls below contracted volumes? Who bears quality risk? How is the price determined? What happens if the plant cannot produce for several days? This is where the distinction between an announcement and an operating business becomes critical. A plant with a signed offtake agreement is not the same as a plant delivering gas reliably every day. Downtime Is the Number Nobody Wants to Headline A CBG plant can have impressive installed capacity and still produce far below its theoretical maximum. The reasons can range from feedstock shortages and equipment failures to maintenance, quality problems, transport disruptions, storage issues or market constraints. That is why the investigation should calculate: Actual uptime = Operating hours ÷ Available operating hours It should then compare: Installed CBG capacity with Actual average production That comparison is more informative than the nameplate number alone. The same principle applies nationally. India reported 189 functional CBG projects as of January 2026, but that figure does not tell readers how much each plant actually produces, how consistently it operates or what proportion uses crop residue as feedstock. Functional is not the same as fully utilised. CBG Is Not the Only Destination for Straw The market for crop residue is becoming more competitive. Straw can be directed towards CBG, biomass power, pellets and briquettes, biofuels and other industrial applications. The Commission for Air Quality Management has also directed Punjab and Haryana to increase the use of paddy-straw-based pellets or briquettes in brick kilns, with the mandated co-firing share rising to 30% from 1 November 2026, after 20% from November 2025. That means new CBG plants are entering a market in which multiple users may compete for the same seasonal material. This could benefit farmers. More buyers can mean more choices. But it can also create instability for plants that require predictable feedstock volumes. The investigation should therefore map the local residue market, rather than treating all available straw as if it automatically belongs to CBG. Perhaps the Answer Is Not One Technology This is where the story should resist a simple conclusion that CBG will “solve stubble burning”. ICAR’s work shows that in-situ residue management can reduce burning while supporting soil-related outcomes. Its work also stresses that machinery availability, maintenance and region-specific solutions matter. At the same time, ex-situ options such as CBG can create a market for residue that farmers otherwise struggle to manage. The stronger policy answer may therefore be a portfolio rather than a winner-takes-all technology race. Some residue can remain in the field. Some can feed CBG. Some can support industrial biomass demand. Some can move into other value chains. The right mix should be determined by soil science, economics, logistics and local conditions. Not by the number of CBG plants announced. What Would a Genuinely Working CBG Farmgate Model Look Like? A strong plant should be able to demonstrate at least ten things: 1. A defined collection radiusNot a vague reference to “nearby farmers”, but a documented sourcing geography. 2. Transparent farmer economicsWhat the farmer receives, what the farmer saves and what costs remain. 3. A functioning aggregation systemWho collects the bale, who owns it and who bears transport risk. 4. Quality controlsMoisture, contamination and rejection records. 5. High and documented plant uptimeNot just installed capacity. 6. Verified methane managementLeak testing and corrective action. 7. A credible digestate pathwayTesting, compliance, price and actual agricultural use. 8. A contracted buyerWith clear price, volume and quality terms. 9. Soil safeguardsEvidence that residue removal does not undermine local soil-health needs. 10. An independently checkable ledgerThe plant should be able to show what entered, what was produced, what was rejected, what was sold and what returned to agriculture. THE CBG ACCOUNTABILITY LEDGER Build a single-page dashboard connecting four stages: FARMGATE → PLANT → OUTPUT → FIELD Track: Farmgate Tonnes collectedFarmers coveredAverage collection distanceFarmer net valueTransport cost Plant Tonnes receivedRejected loadsMoisturePlant uptime Output CBG producedMethane leakageBuyer/offtake Field Digestate returnedFarmers using manureSoil indicatorNutrient balance Every number should carry a date, unit and source. The Documents Should Decide the Story The investigation should not depend on a company presentation deck. The reporting file should seek: feedstock contracts;farmer agreements;FPO and aggregator agreements;weighbridge logs;bale movement records;farmer payment records;transport invoices;moisture and quality-rejection logs;plant production records;downtime records;offtake contracts;methane-leak testing;digestate laboratory reports;fertiliser-compliance documentation;soil assessments;air-quality data;environmental permissions;pollution-control records;and maintenance records. If an operator refuses a document, record the request and the response. If a government agency holds the document, seek it there. If a number cannot be independently verified, label it accordingly. The reporting standard should remain clear: announced, commissioned, operational, maintained and measured are not interchangeable terms. A plant is not a success because it was announced. A capacity figure is not production. A contract is not delivery. And a climate claim is not an outcome until the underlying result can be measured. The Real Test Begins When the Harvest Ends The CBG story is often told from the plant backwards. Look at the digester. Look at the gas. Look at the cylinders. Look at the truck leaving with fuel. But the real story begins much earlier. It begins with a farmer standing in a field after harvest and asking what to do with the straw before the next crop goes in. If CBG gives that farmer a dependable alternative to burning—while protecting soil health, keeping transport costs manageable and creating a genuine economic return—then the technology becomes more than a clean-fuel project. It becomes rural infrastructure. But if the plant depends on expensive long-distance transport, inconsistent feedstock, weak storage, uncertain payments, low utilisation or an unproven digestate market, then the problem has simply moved from the field to the supply chain. And that distinction matters. India does not need more tonnes of theoretical biomass. It needs working contracts, working logistics and working economics. Punjab’s latest crop-residue discussions already point towards this next challenge: nearly 20 million tonnes of paddy straw, a growing network of CBG projects and an urgent need to solve aggregation, transportation, storage and assured offtake while replenishing nutrients where straw is removed. That is why the future of CBG will not be decided inside the digester alone. It will be decided at the farmgate. The Final Farmgate Test When the crop is harvested, does the residue become fuel, income and soil-safe value—or does it simply become another expensive material that someone has to move? That is the question the CBG economy must answer. And it should answer it with evidence—not projections. CAN THE MODEL PASS? FARMER — Is net value positive? FEEDSTOCK — Is supply reliable? PLANT — Is uptime proven? CLIMATE — Is methane leakage measured? SOIL — Is residue removal sustainable? A CBG model should not be called successful until there is evidence on all five.Primary Sources Ministry of Petroleum & Natural Gas (MoPNG) — Compressed Bio Gas / SATAT[https://mopng.gov.in/en/refining/compressed-bio-gas/1000]Punjab Energy Development Agency (PEDA) — Bio-CBG Projects[https://www.peda.gov.in/bio-cbg-compressed-piogas-projects.php]Ministry of New and Renewable Energy (MNRE) — Waste-to-Energy Schemes[https://mnre.gov.in/en/waste-to-energy-schemes/]MNRE — Bio-Energy Programme[https://mnre.gov.in/en/bio-energy-overview/]ICAR — Punjab Crop Residue Management Action Agenda[https://www.icar.gov.in/en/punjab-stakeholders-forge-integrates-action-agenda-crop-residue-management]Punjab Agricultural University (PAU) — VERBIO India, Lehragaga CBG Plant[https://pau.edu/index.php?DO=viewEventDetail&_act=manageEvent&dataE=datae&intID=7702]PIB / Ministry of Jal Shakti — GOBARdhan Scheme and CBG Projects[https://www.pib.gov.in/PressReleasePage.aspx?PRID=2222150&lang=1&reg=3]PIB / Ministry of Petroleum & Natural Gas — CBG Blending Obligation[https://www.pib.gov.in/PressReleasePage.aspx?PRID=1989226&lang=2&reg=48]CAQM / PIB — CBG and Crop Residue Management[https://www.pib.gov.in/PressReleaseIframePage.aspx?PRID=2187847&lang=2&reg=48]National Green Tribunal — Punjab Crop Residue Management Status Report[https://www.greentribunal.gov.in/sites/default/files/news_updates/Status%20Report%20by%20State%20of%20Punjab%20in%20OA%20No.%20632%20of%202023%20%28In%20Re%20News%20item%20published%20in%20The%20Hindu%20dated%2006.10.2023%20titled%20Pollution%20takes%20a%20front%20seat%20as%20Stubble%20Fires%20Spike%20in%20Punjab.pdf] ...Read more

06 Oct 2026

India is building the machines that could power its green-hydrogen ambitions. But the harder test is whether those machines can deliver competitive efficiency, genuine localisation and dependable performance long after the factory gates open. SummaryIndia is rapidly building a domestic electrolyser manufacturing base to support its green-hydrogen ambitions, backed by the National Green Hydrogen Mission and ₹4,440 crore in manufacturing incentives. But approved factory capacity is only the starting point. The real test lies in how much equipment is actually produced, how much of its supply chain is truly local, how efficiently it operates, and whether it can remain reliable and commercially competitive over time. This feature examines the gap between manufacturing promises and operating reality - through localisation, critical minerals, system costs, efficiency, degradation, renewable-power requirements and the evidence buyers should demand before calling an electrolyser truly “Made in India.” THE BIG QUESTION Can India turn electrolyser manufacturing capacity into a genuinely competitive industrial supply chain? India’s green-hydrogen story is gradually becoming a manufacturing story. The country is no longer viewing electrolysers simply as imported equipment required for future hydrogen projects. Through the National Green Hydrogen Mission and its Strategic Interventions for Green Hydrogen Transition (SIGHT) programme, India is seeking to establish a domestic manufacturing base for the equipment that splits water into hydrogen and oxygen. The scale is significant. The National Green Hydrogen Mission aims to position India as a global hub for green hydrogen and targets production of 5 million tonnes per annum by 2030. Under the SIGHT programme, the government has allocated ₹4,440 crore for domestic electrolyser manufacturing. The official MNRE SIGHT portal lists 3,000 MW per year of approved electrolyser manufacturing capacity across two manufacturing tranches: 1,500 MW under Tranche-I and another 1,500 MW under Tranche-II. The headline, therefore, is no longer whether India intends to manufacture electrolysers. It does. The more important question is what exactly “manufacturing” means when the system is examined component by component. INDIA’S ELECTROLYSER MANUFACTURING PUSH Infographic: National Green Hydrogen Mission → SIGHT → Tranche-I: 1,500 MW/year → Tranche-II: 1,500 MW/year → 3,000 MW/year approved capacity Callout: How much of that capacity will translate into actual production? Note: Clearly label 3,000 MW as approved/awarded manufacturing capacity, not equipment produced. FROM HYDROGEN TARGET TO FACTORY FLOOR An electrolyser is deceptively simple in principle. Electricity is passed through water, triggering an electrochemical reaction that separates hydrogen from oxygen. But the machine performing that reaction is a sophisticated industrial system involving a stack, electrodes, catalysts, membranes or diaphragms, bipolar plates, power electronics, pumps, heat-management systems, controls and other balance-of-plant equipment. And not every electrolyser is the same. Alkaline, PEM, solid-oxide and emerging AEM technologies use different materials, designs and operating characteristics. Their supply chains can therefore look very different. This matters because a factory producing an electrolyser system is not necessarily producing every critical component within it. A system can be assembled domestically while some of its most specialised inputs remain imported. That distinction lies at the centre of India’s manufacturing challenge. The policy objective, therefore, is not simply to increase the number of machines carrying a “Made in India” label. It is to build an industrial ecosystem capable of producing reliable equipment at competitive cost while reducing vulnerable import dependencies. The editorial brief for this feature identifies precisely these tests: quality, localisation, minerals, efficiency and after-sales performance—not factory ribbon-cutting. CAPACITY IS NOT THE SAME AS OUTPUT The first number any manufacturing story tends to celebrate is capacity. But capacity is only the beginning. A manufacturer may announce a plant with a particular annual nameplate capacity. A government tender may award manufacturing capacity. A facility may be constructed. Equipment may be installed. Production may begin. These are different stages. For this story, the useful ladder is: ANNOUNCED → AWARDED → BUILT → COMMISSIONED → PRODUCING → SOLD → INSTALLED → OPERATING → MAINTAINED → MEASURED The MNRE portal lists eight Tranche-I projects with scheduled commissioning dates in August 2026, while the listed Tranche-II projects have a scheduled commissioning date of 26 March 2027. As of October 2026, however, a scheduled commissioning date should not automatically be interpreted as evidence of actual commercial output. The evidence threshold must be higher. India’s electrolyser manufacturing progress should increasingly be measured through harder indicators: How much capacity has been physically commissioned?How much equipment has actually been produced?What is the plant’s utilisation rate?How many stacks or systems have been sold?Where are they operating?What is their measured efficiency?How quickly does performance degrade?What does the warranty cover?Which components are domestically sourced?Which remain imported?How quickly can replacement parts be supplied?This is where the story moves from industrial policy to industrial reality. CAPACITY ≠ OUTPUT Status ladder: Announced → Awarded → Built → Commissioned → Producing → Sold → Operating → Measured Centre callout: 3,000 MW/year = approved manufacturing capacity, not 3,000 MW produced. WHAT DOES “MADE IN INDIA” REALLY MEAN? The phrase sounds straightforward. The supply chain is not. A complete electrolyser system can contain dozens of components and materials, and the domestic share can differ substantially between technologies. A 2024 CEEW assessment examined PEM, alkaline and solid-oxide electrolysers and found substantial potential for localisation across all three. It estimated overall indigenisation potential at 82% for PEM, 88% for alkaline and 85% for solid-oxide electrolysers. The report also identified specialised materials and critical minerals as continuing supply-chain challenges. The distinction is crucial: Potential indigenisation is not the same as current indigenisation. The CEEW assessment estimated manufacturing costs of roughly USD 350–400 per kW across the technologies it studied and identified opportunities to reduce stack costs through higher current density, lower catalyst loading, thinner coatings and alternative materials. For PEM systems, the report found that around 72% of manufacturing cost could be readily indigenised in its assessment, while components such as Nafion membranes and minerals including platinum and iridium remained areas of import dependence. For alkaline systems, the picture is different but still not completely domestic. The CEEW analysis identified opportunities to manufacture or process several components in India while pointing to continuing dependence on imported materials and commodities. So the question should move from: “How much of the electrolyser is Indian?” to: “Which parts are Indian, which are imported, and which supply chains could become bottlenecks as production scales?” That is a much more useful manufacturing question. WHAT ACTUALLY SITS INSIDE AN ELECTROLYSER? Technical cutaway: Stack, electrodes, catalyst, membrane/diaphragm, bipolar plates, power electronics, water treatment, cooling, gas handling and controls. Show two labels: Domestic manufacturing potential | Import / critical-material exposure Callout: “Made in India” is a supply-chain question, not just an assembly question. THE CRITICAL-MINERAL QUESTION The localisation debate cannot stop at factories. It has to reach the materials inside those factories. Electrolyser technologies use different combinations of materials, and some specialised components rely on minerals for which India does not have sufficient domestic resources or established supply chains. This creates a strategic dilemma. Trying to manufacture everything domestically may not always be technically or economically sensible. But relying heavily on a narrow group of foreign suppliers can create another vulnerability. The better objective is therefore supply-chain resilience. That can mean: developing domestic component manufacturing;processing imported raw materials within India where economically viable;reducing the quantity of critical minerals required per unit of hydrogen;developing alternative materials;diversifying international suppliers;building domestic testing and certification capabilities;investing in research into next-generation electrolyser technologies.The CEEW study specifically identifies reduced catalyst loading, alternative materials and technology development as potential routes to lower costs and increase localisation. The strategic question is not whether India can eliminate every import. It is whether India can prevent one imported component, mineral or technology from becoming a single point of failure. THE HIDDEN COST: THE SYSTEM AROUND THE STACK Another reason headline manufacturing capacity can be misleading is that the stack is only one part of the overall economics. CEEW’s assessment found that balance of plant can account for 50–60% of the total electrolyser system cost. That changes the procurement conversation. A buyer should not compare two electrolysers simply by comparing the quoted price of their stacks. The relevant comparison is the complete system. That includes: STACK + POWER ELECTRONICS + WATER TREATMENT + COOLING + GAS PROCESSING + CONTROLS + INSTALLATION + MAINTENANCE + REPLACEMENT + FINANCING A cheaper machine that consumes more electricity, degrades faster or requires expensive imported replacement parts may not remain cheaper over its operating life. The real metric is therefore not simply: ₹ per kW of electrolyser but increasingly: ₹ per kilogram of hydrogen over the operating life of the system. That is where manufacturing competitiveness becomes commercial competitiveness. THE STACK IS ONLY PART OF THE BILL Infographic: Stack + power conversion + water treatment + cooling + gas handling + controls + installation + maintenance. Highlight: Balance of plant = 50–60% of total system cost Bottom line: Purchase price ≠ lifetime cost EFFICIENCY: THE NUMBER THAT NEEDS A COMMON RULE Efficiency sounds like a simple number. In practice, it requires a common measurement framework. Two manufacturers can describe system performance differently depending on what is included in the calculation, how electricity consumption is measured and under what operating conditions the test is performed. That makes standardisation critical. A June 2025 BIS draft standard on efficiency assessment of AEM, PEM and alkaline water electrolysers note that different electrolyser technologies have different configurations, materials, operating conditions and performance characteristics. It also states that meaningful comparison requires a standardised procedure for evaluating system performance. The document highlights another important complication: some performance characteristics can be assessed during initial testing, while aspects related to equipment life become clearer only through operation and accelerated testing. For buyers, therefore, the important question is not merely: “What efficiency does the manufacturer claim?” It is: “Under what test protocol was that efficiency measured, at what load, and which parts of the system were included?” Without comparable testing, headline efficiency numbers can be difficult to use in procurement decisions. WHEN TWO EFFICIENCY NUMBERS ARE NOT COMPARABLE Comparison graphic: Two illustrative electrolyser test cards showing: Efficiency → Operating load → Temperature → Pressure → System boundary Centre: STANDARDISED TESTING Note: Do not use invented manufacturer numbers. THE PERFORMANCE TEST DOES NOT END WHEN THE MACHINE STARTS An electrolyser can perform well when new and still become a different economic proposition several years later. That makes degradation one of the most important—and least headline-friendly—questions in the sector. A serious buyer needs to know: How quickly does stack performance decline?What operating conditions accelerate degradation?How frequently does the stack need replacement?What is covered under warranty?What happens when efficiency falls below the guaranteed level?Who supplies replacement components?How long will critical spare parts remain available?Who carries the performance risk?These questions matter because hydrogen projects are not buying a machine for a photograph. They are buying an operating asset. If an electrolyser is expected to function for years, uptime, degradation and service availability can ultimately matter as much as its initial purchase price. The editorial brief therefore calls specifically for degradation data, warranty claims and signed customer orders, rather than relying only on factory-capacity claims. THE RENEWABLE POWER QUESTION There is another part of the electrolyser equation that sits outside the factory. Electricity. Green hydrogen is only as credible and economically viable as the renewable electricity system supporting its production. An electrolyser may be technically excellent, but its economics can deteriorate if the electricity feeding it is expensive, unreliable or poorly matched to its operating profile. This creates a second test for Indian manufacturing. Can domestically manufactured electrolysers operate efficiently under the actual renewable-power conditions that Indian projects will face? Solar-heavy systems, for example, can experience changing electricity availability throughout the day. That makes dynamic operation, power-electronics performance and degradation behaviour important procurement considerations. The machine therefore cannot be assessed in isolation. The chain is: RENEWABLE ELECTRICITY → WATER → ELECTROLYSER → HYDROGEN → STORAGE / TRANSPORT → INDUSTRIAL CUSTOMER A weakness anywhere along that chain can affect the economics of the final kilogram of hydrogen. THE HYDROGEN MOLECULE’S FULL ITINERARY Systems map: Renewable electricity → Water → Electrolyser → Hydrogen conditioning → Storage → Transport → Industrial buyer Under each stage, ask one short question: Power: Affordable? Water: Available? Electrolyser: Who made it? Performance: How efficient? Storage: What infrastructure? Transport: What cost? Buyer: Who pays? Callout: A green-hydrogen project is a chain, not a machine. INDIA’S ADVANTAGE — AND ITS COMPETITIVE PROBLEM India has a major reason to pursue domestic electrolyser manufacturing. It wants the economic benefits of the green-hydrogen transition to extend beyond hydrogen production itself into manufacturing, engineering, components, services and jobs. But the global market is already competitive. The International Energy Agency’s Global Hydrogen Review 2026 reports that installed global electrolysis capacity doubled in 2025 to more than 4 GW, with China accounting for nearly three-quarters of new installations. The IEA also says electrolyser manufacturing is entering a consolidation phase as market development remains slow. That creates a difficult environment for India. The country is attempting to build manufacturing capacity while the global industry itself is still searching for stable demand and sustainable economics. The challenge is therefore not simply to make electrolysers. It is to make them: CHEAP ENOUGH. EFFICIENT ENOUGH. RELIABLE ENOUGH. SERVICEABLE ENOUGH. to win real orders. That is a much higher bar. THE GLOBAL ELECTROLYSER RACE Global map: Highlight India and China. Show the comparison around: Scale | Cost | Technology | Project experience | Domestic demand | Export potential Bottom line: The competition is for cost, scale, reliability and customers—not just technology. THE GLOBAL LESSON: CHEAP EQUIPMENT IS NOT THE WHOLE STORY China’s position provides an important comparison. The IEA reports that China has become the leading centre for electrolyser deployment and manufacturing, benefiting from lower technology costs and experience with large projects. But the same analysis points to excess capacity and market consolidation. The lesson for India is not that domestic manufacturers must simply imitate China. It is that manufacturing scale alone does not guarantee sustainable industrial competitiveness. A country can have factories and still struggle with: weak demand;underutilised capacity;thin margins;imported critical components;insufficient testing infrastructure;limited after-sales networks;technology dependence;financing constraints;inadequate customer confidence. The strongest industrial ecosystem is therefore not necessarily the one with the largest announced factory capacity. It is the one whose manufacturers can continue delivering after subsidies, incentives and policy headlines become less central to the business case. THE REAL PROCUREMENT TEST For developers and industrial buyers, the questions should become more demanding. Before purchasing an electrolyser, a buyer should be able to request a documentary record covering at least: 1. FACTORY CAPACITY What is the annual nameplate capacity, and what is the actual production? 2. BILL OF MATERIALS What are the major components, and where does each come from? 3. TECHNOLOGY Is the system alkaline, PEM, SOEC, AEM or another configuration? 4. EFFICIENCY What test protocol produced the quoted efficiency figure? 5. DEGRADATION What performance decline is expected over time? 6. WARRANTY What exactly is guaranteed, for how long and under what operating conditions? 7. WATER What water quality does the system require, and what treatment infrastructure is necessary? 8. OPERATING EVIDENCE How many systems are actually operating, and for how long? 9. CUSTOMER EVIDENCE Are there signed customer orders rather than only memoranda or announcements? 10. LIFETIME ECONOMICS What is the expected total cost of producing hydrogen over the equipment’s operating life? This is the point where “Made in India” becomes a measurable industrial proposition rather than a branding exercise. BEFORE BUYING AN ELECTROLYSER, ASK FOR THE FILE ☐ Factory capacity vs. actual output ☐ Bill of materials ☐ Supplier origin ☐ Technology / chemistry ☐ Efficiency test protocol ☐ Degradation data ☐ Warranty terms ☐ Water requirement ☐ Operating customer evidence ☐ Lifetime hydrogen cost Callout: If the number matters to the business case, ask for the document behind the number. WHAT SHOULD INDIA MEASURE NEXT? India’s next manufacturing phase should be judged through a different dashboard. Not just: MW OF ANNOUNCED CAPACITY but: MW COMMISSIONED MW ACTUALLY PRODUCING UTILISATION RATE PERCENTAGE OF COMPONENTS LOCALLY SOURCED CRITICAL-MATERIAL EXPOSURE MEASURED SYSTEM EFFICIENCY ANNUAL DEGRADATION STACK REPLACEMENT INTERVAL WARRANTY PERFORMANCE NUMBER OF OPERATING CUSTOMER SYSTEMS SYSTEM AVAILABILITY COST PER KILOGRAM OF HYDROGEN These indicators would reveal whether the domestic electrolyser industry is moving from policy-supported capacity creation towards commercially durable manufacturing. The government intervention has already created a strong market signal: according to MNRE, 15 companies have been awarded 3,000 MW/year of electrolyser manufacturing capacity with ₹4,440 crore in total incentives. The next phase is about proving what those numbers produce in practice. FROM ANNOUNCEMENTS TO OPERATING DATA OLD MEASUREBETTER MEASUREAnnounced MWCommissioned MWFactory capacityActual outputLocal assemblyLocal component shareClaimed efficiencyStandardised tested efficiencyNew equipmentOperating equipmentPurchase priceLifetime costWarranty promiseWarranty performanceCustomer announcementSigned order + operating evidence THE BUSINESS CASE BEHIND THE CLIMATE CASE There is a tendency to frame green hydrogen as a climate technology first and an industrial technology second. For electrolysers, the order increasingly needs to be reversed. The climate ambition depends on industrial performance. If electrolysers are expensive, inefficient or unreliable, green hydrogen becomes more expensive. If green hydrogen remains expensive, demand can remain weak. If demand remains weak, manufacturing plants can operate below capacity. If factories operate below capacity, domestic suppliers struggle to build economies of scale. And if component suppliers cannot scale, import dependence can persist. That creates a cycle: HIGH EQUIPMENT COST ↓ EXPENSIVE HYDROGEN ↓ WEAK DEMAND ↓ LOW FACTORY UTILISATION ↓ LIMITED SCALE ↓ WEAK SUPPLY CHAIN India needs to build the opposite cycle: RELIABLE EQUIPMENT ↓ COMPETITIVE HYDROGEN ↓ STRONGER DEMAND ↓ HIGHER UTILISATION ↓ SUPPLIER SCALE ↓ LOWER COST ↓ STRONGER DOMESTIC INDUSTRY That is the real industrial prize. THE BUSINESS-CASE CYCLE Risk cycle: High cost → Expensive hydrogen → Weak demand → Underused factories → Weak supply chain Industrial cycle: Reliable equipment → Competitive hydrogen → Demand → Scale → Lower cost → Stronger industry Centre question: Which cycle will India’s electrolyser industry enter? WHAT THE EVIDENCE SHOULD LOOK LIKE The strongest version of this story is not built around the number of factories announced. It is built around documents. For each major manufacturing claim, the evidence hierarchy should move from: Policy announcement → Letter of award → Factory commissioning evidence → Production data → Customer order → Operating data → Performance data → Independent verification, where available This distinction matters because announcements are not equivalent to operational outcomes. For this reason, the article should not claim that every SIGHT-listed factory is already producing at its awarded capacity unless documentary evidence establishes that. The absence of such evidence is itself important. It tells the reader where India’s manufacturing story currently has a measurement gap. THE EVIDENCE LADDER Announced → Awarded → Commissioned → Producing → Operating → Measured → Independently verified Callout: The higher the evidence, the stronger the claim. THE BOTTOM LINE India has moved beyond the stage where electrolyser manufacturing is merely an aspiration. Policy support exists. Manufacturing capacity has been awarded. Companies are developing production capabilities. The potential for substantial localisation is real. But: CAPACITY IS NOT YET COMPETITIVENESS. A factory can have a nameplate capacity without producing at that level. A machine can be assembled domestically while relying on imported critical components. A low purchase price can conceal higher lifetime electricity, maintenance or replacement costs. And a promising technology can still struggle if customers cannot secure affordable renewable electricity or dependable long-term service. The next chapter of India’s electrolyser story therefore needs fewer ribbon-cutting numbers and more operating numbers. The decisive evidence will come from: production records, component origins, standardised efficiency tests, degradation data, warranties, customer orders, operating experience and lifetime cost. India does not simply need electrolyser factories. It needs an electrolyser industry that can: SURVIVE AFTER INCENTIVES. COMPETE AFTER HEADLINES. PERFORM LONG AFTER THE RIBBON IS CUT. Because a factory can make a stack. The real question is whether the stack can make a business case.SOURCES & DOCUMENTATION: Ministry of New and Renewable Energy — National Green Hydrogen Mission / SIGHT approved projects MNRE National Green Hydrogen Mission — SIGHTMinistry of New and Renewable Energy — SIGHT Supply Incentives MNRE — SIGHT Supply IncentivesPress Information Bureau / MNRE — National Green Hydrogen Mission progress PIB — National Green Hydrogen Mission progressPress Information Bureau / MNRE — Green Hydrogen expansion and electrolyser manufacturing PIB — Green Hydrogen expansion and electrolyser manufacturingMNRE — India's Green Hydrogen Revolution MNRE — India's Green Hydrogen RevolutionCouncil on Energy, Environment and Water — How can Hydrogen Electrolysers be Made in India? CEEW — Hydrogen Electrolyser Manufacturing in IndiaInternational Energy Agency — Global Hydrogen Review 2026 IEA — Global Hydrogen Review 2026International Energy Agency — Global Hydrogen Review 2026: Production IEA — Global Hydrogen Review 2026: ProductionBureau of Indian Standards — Draft efficiency assessment standard for electrolysers BIS — Draft efficiency assessment standard ...Read more

26 Sep 2026

September 25, 2026 | Kolkata Faith-based giving often reaches people long before a formal programme does. From langars and annaprasadam to zakat, daan and church-led welfare, millions of rupees, meals, medicines, education and volunteer hours move through religious and community institutions. But when giving becomes a large social-service system, devotion alone cannot be the only ledger that matters. The real test is whether money, food, labour and care can be traced to outcomes - with dignity, safety, consent and accountability intact. SummaryIndia's faith-based giving ecosystem is enormous, diverse and difficult to measure as one sector because zakat, daan, seva and religious charity operate according to different traditions and institutional structures. Current documentary evidence shows everything from Tirumala's large-scale free-food system and the Golden Temple's langar to structured zakat programmes funding education, livelihoods and food relief. At the same time, India's formal CSR system reported about ₹40,794 crore in expenditure in FY2024-25, with detailed disclosure requirements that make corporate giving comparatively easier to track. (Corporate Data Management Portal) The question is not whether faith-based giving is charitable enough; it is whether institutions handling public-facing welfare can make their finances, procurement, beneficiary selection, safeguards and outcomes visible enough to earn durable trust. The strongest models suggest that faith and accountability do not have to compete. They can reinforce each other when the sacred act of giving is matched by a secular discipline of evidence. Can Faith-Based Giving Reach the Last Mile Without Losing Accountability Along the Way? There is an old Indian habit of giving before asking for a receipt. A handful of rice placed in a temple collection, money dropped into a mosque’s charity box, a contribution to a gurdwara kitchen, food distributed through a church, a daan to a community trust, or a few hours of seva may never be described as philanthropy. But added together, these everyday acts of giving can form substantial systems of welfare. They feed people. They support students. They help pay medical bills. They provide water. They keep community kitchens running. They support families through crises. And because they are rooted in local communities, they can often mobilise people, food and resources faster than formal programmes. That reach is part of their strength. But it also raises a question that is neither cynical nor anti-faith. It is a question of stewardship. What happens to the giving after it leaves the donor’s hand? Who receives it? Who decides where it goes? How much reaches the person it was meant to help? And what systems exist to ensure that trust is not misplaced? These questions do not diminish the act of giving. They recognise the responsibility that comes with it. Faith-based giving is built on trust. But when that trust becomes a large and recurring flow of money, food, property, volunteer time or other resources, accountability becomes part of protecting the very purpose behind the giving. The question is not whether faith should give. It is whether every act of giving can travel the last mile with its purpose, dignity and impact intact. Why Can’t Faith-Based Giving Be Measured Like CSR? Before asking how faith-based giving should be measured, it is important to understand what is actually being given and why. The language of giving itself reveals why a simple comparison with corporate philanthropy does not work. Zakat is an Islamic obligation governed by defined religious principles concerning eligible giving and recipients. Daan in Hindu traditions can refer to voluntary giving shaped by religious, ethical and social ideas. Seva in Sikh practice centres on selfless service and participation, rather than simply transferring money or resources from one person to another. These are not interchangeable versions of CSR. A langar, for instance, is not simply a corporate food-distribution programme with a religious identity attached to it. The principle of seva shapes the entire relationship between giving and receiving. At the Golden Temple, people from different backgrounds sit together and share the same meal, while volunteers participate in cooking, serving and cleaning. The value lies not only in how much food is distributed, but also in the system of participation, equality and service through which it is provided. That distinction matters when accountability enters the conversation. Transparency should not flatten the cultural or religious meaning of the institution being examined. A reporting framework that treats every form of giving as a financial transaction risks measuring the activity while missing its purpose. The question, therefore, is not: Can faith be converted into a corporate reporting template? It is a more useful one: Can faith-based institutions preserve the traditions that give their work meaning while making the public consequences of that giving transparent and verifiable? That is where accountability and cultural integrity have to meet. When Giving Becomes an Institution, Does Accountability Change? Faith-based giving is already operating at a scale far beyond the occasional donation. Consider Tirumala Tirupati Devasthanams (TTD). Its approved 2026–27 budget stands at ₹5,456.26 crore, including ₹118.89 crore for its educational institutions. The board has also approved a new Annaprasadam complex and modern kitchen, with Reliance Industries proposing a ₹100–120 crore donation towards the project. (Source: TTD News) The scale of its food operation is equally significant. TTD’s official Annaprasadam information lists capacity of roughly 1.59 lakh meals on weekdays and 2.05 lakh on weekends across its various locations, with substantially higher service during major occasions. The system also involves the daily consumption of large quantities of rice, vegetables and milk, alongside donation-based supplies. (Source: Tirumala Tirupati Devasthanams) Donations continue to flow into the system. In April 2026, ₹44 lakh was donated for a day’s Annaprasadam distribution. In May, an anonymous devotee donated more than ₹1 crore, while in July, the trust reported receiving another ₹60.61 lakh from several donors. (Source: TTD News) At this scale, the question is no longer simply whether devotees are giving. It is about how a large food-and-service institution manages what they give. That brings procurement, storage, food safety, wastage, maintenance, donor restrictions and beneficiary access into the conversation. Once giving becomes a system, stewardship has to become a system too. The Langar Economy Shows What Seva Looks Like at Scale The same shift can be seen at Amritsar’s Golden Temple. A June 2026 report by The Indian Express described the Guru Ramdas Langar as feeding more than 1.2 lakh devotees every day during the summer peak. The infrastructure required to sustain that service is enormous. During an LPG supply disruption in March 2026, The Times of India reported that the kitchen was using around 25 LPG cylinders and 1,200 units of piped gas every day, while maintaining a reserve of more than 500 quintals of firewood. These figures reveal something important about seva. Service has infrastructure. There are kitchens, procurement systems, fuel supplies, storage facilities, transportation, cleaning operations, workers and volunteers. There are also food-safety responsibilities and costs that exist regardless of whether the service is described as charity, devotion or seva. The financial scale is substantial as well. According to the SGPC, as reported by The Tribune, offerings and donations at Sikh shrines under its control totalled around ₹632 crore during FY2025–26. The SGPC has also said it has mechanisms for managing daily cash offerings and donations. So the accountability question moves beyond: “Are people being fed?” It becomes: How is the food procured? How much is donated in kind? How much is spent? How much is wasted? What controls exist over cash? Who audits the system? And what happens when something goes wrong? The purpose is not to turn langar into a corporate operation. It is to recognise that an institution built on service still has an obligation to protect the people it serves and the trust that sustains it. Zakat Adds Another Question: Does Giving Relieve Poverty or Reduce It? The zakat ecosystem brings another dimension into the discussion: what happens after immediate relief? The Association of Muslim Professionals’ AMP Zakat Fund reported that in 2025 it disbursed ₹2.64 crore to 4,491 beneficiaries. Its published allocation included approximately ₹98 lakh for higher education, ₹61 lakh for self-employment, ₹67 lakh for basic education, ₹31 lakh for food relief and ₹8 lakh for ulema support. The fund reported assistance to 552 higher-education students, 223 self-employment beneficiaries and 3,091 families through food support. (Source: AMP Zakat Fund Impact Report 2025) The model illustrates why the outcome of giving can matter as much as the amount distributed. Food can prevent hunger today. A scholarship can influence a student’s next decade. A livelihood grant can reduce repeated dependence. That changes the accountability question. It is no longer enough to report: “₹2.64 crore distributed.”A stronger account asks: 1.    How many people applied?2.    What determined eligibility?3.    How many applications were accepted or rejected?4.    How much reached each beneficiary?5.    How much went towards administration?6.    How many students continued their education?7.    How many livelihood beneficiaries remained economically active?8.    How much food support was one-time and how much was recurring? In March 2026, The Indian Express reported estimates of Indian zakat collections during Ramadan ranging from ₹10,000 crore to ₹40,000 crore, while also making clear that these were estimates rather than an official national accounting. The enormous range itself reveals the problem. India has a vast culture of giving. It does not yet have a single reliable national ledger for faith-based giving. What Can Formal Charities Teach Without Replacing Faith? Christian charitable organisations offer another useful example: faith-based motivation can coexist with formal documentation. Operation Barnabas, a registered Christian charitable trust, published an audited 2024–25 report covering medical assistance, education and social welfare. It reported helping 255 families with ₹1.36 crore in medical aid during the year and nearly 6,500 medical claims reimbursed since the programme began. Its annual report also includes an independent auditors’ report and a statement concerning the utilisation of foreign contributions under FCRA. (Source: Operation Barnabas Annual Report 2024–25) This does not automatically prove that every programme was effective. An audit can establish that financial records exist. It cannot, by itself, prove that every intervention achieved its intended social outcome. But it creates something important: a documentary trail that another party can examine. That is the difference between trust as belief and trust as governance. Good accountability does not ask donors to stop trusting. It gives them more reasons to trust. So, How Different Is Faith-Based Giving From CSR? The two systems are fundamentally different, but they increasingly intersect. India’s CSR framework is statutory. Companies covered by Section 135 of the Companies Act operate within a defined framework, with CSR expenditure reported through the Ministry of Corporate Affairs. The government has reported that companies filed more than ₹1.44 lakh crore in CSR expenditure between FY2019–20 and FY2023–24. MCA data also records approximately ₹40,794 crore in disclosed CSR expenditure for FY2024–25. (Source: Ministry of Corporate Affairs / Press Information Bureau) CSR comes with formal mechanisms including annual action plans, board oversight, disclosures, CFO certification and, for qualifying projects, independent impact assessment. Faith-based giving does not operate under one equivalent national framework. Religious and charitable trusts can receive voluntary contributions and obtain tax benefits under applicable provisions, subject to statutory conditions. Registered trusts can also face audit and reporting requirements, including Form 10B where applicable. Foreign contributions are governed separately under FCRA, which requires the relevant registration or prior permission and imposes reporting and compliance requirements. There is another distinction that needs to remain clear: CSR money cannot simply become religious expenditure because a religious institution is willing to receive it. CSR spending must relate to activities permitted under Schedule VII. These include areas such as hunger, healthcare, sanitation, safe drinking water, education, livelihoods, environmental sustainability and rural development. A temple, mosque, church or gurdwara can therefore potentially participate in a CSR project when the project itself satisfies the CSR framework. Religious identity alone does not make an activity CSR-eligible. That distinction protects both systems. The Real Accountability Test Begins After the Donation The entire question can be reduced to one chain: Donation → Allocation → Procurement → Delivery → Beneficiary → Outcome → Maintenance If the chain breaks at any point, accountability becomes weaker. A food programme should therefore report more than the number of meals served. It should be able to demonstrate appropriate procurement, food safety, storage, wastage management and maintenance. A water project should establish the baseline, number of users, water quality, operating costs and responsibility for maintenance. A scholarship should disclose eligibility criteria, number of recipients, amount per recipient and continuation. A medical programme should track patients, treatment completed, referral outcomes and safeguarding. A livelihood programme should ask the harder question: Did the intervention actually change income or economic stability? And a volunteer programme should distinguish between hours contributed and social value created. This is where formal philanthropy has something useful to offer faith-based institutions. Not because corporate systems are perfect. They are not. But because measurement forces an organisation to confront the gap between activity and outcome. Can Accountability Protect Dignity Too? There is another ledger that cannot be reduced to rupees. A person receiving food is not a photograph. A child receiving a scholarship is not a CSR success story. A patient receiving treatment is not an impact statistic. A woman receiving livelihood support is not a donor testimonial. Faith-based institutions can have an important advantage here. Their traditions of service can challenge the hierarchy between giver and receiver. The principle of langar, for example, brings people together rather than creating a visible divide between those who give and those who receive. But moral authority can also create a different risk. When an institution is deeply trusted, beneficiaries, volunteers or staff may find it difficult to question decisions or report wrongdoing. That makes safeguarding and grievance mechanisms essential. A credible institution should provide a way for someone with less power to say: The food was unsafe. The money did not arrive. The selection process was unfair. The volunteer abused his position. The promised service stopped. My personal information was misused. Accountability becomes meaningful only when the person receiving the service has a way to challenge the person providing it. A Sacred Kitchen Still Needs Food Safety Food safety does not become optional because food is sacred. India’s food regulator has recognised this through FSSAI’s Eat Right Place of Worship initiative, which encourages religious institutions handling prasad, langar and other food to adopt food-safety and hygiene practices. The certification process includes registration or licensing, audits and training. FSSAI’s BHOG guidance was also developed specifically to improve food safety at places of worship and address food served as prasad and langar. The principle is simple. A meal given freely can still make someone sick. A sacred kitchen still needs clean water. A volunteer still needs training. A large food operation still needs traceability. And a beneficiary still has the right to safety. Faith can determine why the food is served. It cannot remove the responsibility to ensure that the food is safe. Where Does the Debate Actually Stand? There are at least three legitimate positions. The faith-first view argues that imposing corporate-style measurement on seva, daan or zakat can misunderstand the purpose of giving. Much of this work is sustained by trust, volunteerism and spiritual obligation rather than managerial targets. Excessive paperwork could also divert resources away from actual service. That concern deserves to be taken seriously. The accountability-first view starts from a different premise: once an institution manages significant donations and provides essential services, donors and beneficiaries have a legitimate interest in knowing where resources go. Transparency can protect institutions from misuse, waste and reputational damage. Then there is a bridge position. The goal does not have to be making religious giving imitate CSR. It can be establishing a minimum public-interest evidence standard. Different faiths can retain different definitions of giving. Their accountability can still share common questions: How much came in? Where did it go? Who received it? What was actually delivered? Was it safe? Was consent respected? What changed? Who maintains it now? What Should a New Sacred Ledger Record? A practical framework could begin with ten minimum disclosures: 1. Money receivedCash, digital donations, grants, corporate contributions and in-kind donations. 2. Money allocatedFood, water, education, healthcare, infrastructure, administration and other categories. 3. ProcurementMajor suppliers, procurement methods and basic conflict-of-interest and price-transparency controls. 4. Beneficiary denominatorNot simply “thousands helped”, but how many were eligible, reached and actually served. 5. SafetyFood safety, medical safeguards, child protection, volunteer protocols and grievance mechanisms. 6. Consent and dignityNo forced publicity, exploitative storytelling or unnecessary use of identifiable beneficiary images. 7. OutcomesWhat changed after the intervention—not simply what activity took place. 8. ContinuityWho pays for maintenance after the donation or project ends. 9. Independent verificationAudited accounts where applicable, external evaluation for significant programmes and mechanisms for correcting public errors. 10. Faith identity without exclusionThe institution should explain its religious purpose clearly without disguising the eligibility rules for a particular service. This is not a demand for one standardised theology. It is a demand for a common language of stewardship. What Happens When Corporate Money Meets Faith-Based Reach? There is also a significant opportunity for partnerships between religious institutions, companies, civil society and government. Faith-based institutions can bring trust, community reach and volunteer labour. Corporates can bring funding, technology, procurement capacity and monitoring systems. Civil society organisations can bring implementation expertise. Government can bring infrastructure, regulation and scale. Together, these strengths can support projects that none of the actors could deliver as effectively alone. But the partnership cannot become: Corporate money → religious branding → photo opportunity → impact claim It needs to become: Need → Baseline → Community consent → Funding → Implementation → Independent monitoring → Outcome → Public reporting The same discipline that CSR requires of formal implementing agencies can inform these partnerships even where it is not legally mandatory. The objective is not to make faith more corporate. It is to make partnerships more trustworthy. The Sacred Ledger Is Ultimately About Trust The strongest argument for accountability does not come from a spreadsheet. It comes from the person who gives. Someone donates because they believe an institution will use the contribution well. Someone volunteers because they believe their labour will help another person. Someone accepts a meal because they believe it will be safe. Someone accepts a scholarship because they believe the institution will honour its promise. That belief is trust. And trust is an asset. It can be strengthened. It can also be depleted. India therefore does not have to choose between faith and evidence. It does not need to turn zakat into CSR, daan into a corporate grant or seva into an annual KPI. The more meaningful goal is simpler: Let every form of giving retain its own meaning. But let every large act of giving leave behind enough evidence to show that its purpose survived the money. That is what a sacred ledger should ultimately protect. Not the appearance of accountability. Not a polished annual report. Not another number for a donor presentation. The trust between the giver, the institution and the person receiving the help. Because when giving becomes large enough to shape lives, run kitchens, fund education, provide healthcare or build public infrastructure, accountability is no longer separate from the act of giving. It becomes part of the giving itself. And that is the real promise of a sacred ledger: What is given in faith must be handled with care, delivered with dignity, and accounted for with evidence. Primary sources: Tirumala Tirupati Devasthanams (TTD) – Sri Venkateswara Annaprasadam TrustTTD Annaprasadam Trust TTD – Quality and food-safety management of Annaprasadam, June 2026TTD News – Quality Annaprasadam Shiromani Gurdwara Parbandhak Committee (SGPC) – Daswandh & DonationsSGPC – Daswandh/Donations SGPC – Annual Budget 2026–27SGPC – 2026–27 Budget Association of Muslim Professionals (AMP) – Zakat Fund Impact Report 2025AMP Zakat Fund Impact Report 2025 Income Tax Department – Form 10B for charitable/religious trusts and institutionsIncome Tax Department – Form 10B Food Safety and Standards Authority of India (FSSAI) – BHOG Manual: Food Safety & Hygiene in Places of WorshipFSSAI – BHOG Manual Ministry of Corporate Affairs (MCA) – CSR FAQ / implementing agenciesMCA – CSR FAQ Ministry of Home Affairs (MHA) – Foreign Contribution Regulation Act (FCRA)MHA – FCRA / Foreigners Division ...Read more

09 Sep 2026

India’s rural schools are not empty because families have stopped valuing education. They are losing relevance because the system has struggled to deliver learning, capable teachers, functional infrastructure and pathways to a changing world. As India looks towards 2030, rebuilding the rural government school must become a priority—not simply by adding infrastructure, but by restoring capability, dignity and trust. SummaryIndia’s rural government schools face a deeper crisis than declining enrolment: many are struggling to deliver foundational learning, adequate infrastructure, teacher availability and meaningful pathways for children. Despite near-universal enrolment among rural children, learning outcomes remain uneven, while teacher vacancies, single-teacher schools and infrastructure gaps continue to weaken the public-school experience. The challenge is not simply whether schools should remain open, but whether they can become relevant to the aspirations and realities of rural families. The article examines policy efforts under NEP 2020, NIPUN Bharat and the 2030 education agenda, alongside examples of communities and states rebuilding public-school capacity. It argues for stronger teachers, mastery-based learning, digital and AI literacy, nutrition, functional infrastructure, local skills and transparent community participation. By 2030, the real measure of success should be the capabilities and opportunities a rural school gives every child—not merely the number of schools or students on paper. Why rural India's government schools are losing relevance - and how to rebuild them by 2030 NEP 2020 promises children who can read, reason, create, code and choose a livelihood. In too many villages, the State still struggles to provide the teacher, toilet, meal and lesson needed to get there. The rural school is not redundant. Its delivery model is. The central question in rural Indian education is no longer whether children are enrolled. It is whether the school gives them enough power to read with understanding, handle numbers, communicate across languages, use digital tools safely, question an automated answer and imagine work beyond inherited occupations. Across large parts of the country, government schools remain present in official registers but absent from the future children are being prepared to enter.This is not a claim that every public school is failing, or that private schools are automatically better. Kerala, Himachal Pradesh, Punjab, Tamil Nadu and many individual schools elsewhere show that public education can be rigorous, humane and trusted. Nor is a merger always wrong: a school with five children, one exhausted teacher and no laboratory may need a stronger nearby hub. The harder point is that the average rural public-school design has drifted away from both family aspirations and India's own stated education policy. A school may become empty because families lost faith, and families may lose faith because the school became empty. That is a policy loop, not a verdict on the child.  Access has widened. Learning has not caught up. India has made a significant access achievement. ASER 2024 found that 98.1 per cent of rural children aged 6-14 were enrolled. Families have not rejected education; they have brought children to the school gate. The crisis begins after the gate. In 2024, only 23.4 per cent of Grade III children in government schools could read a Grade II-level text. By Grade V, the figure was 44.8 per cent in government schools, compared with 59.3 per cent in private schools. Only 27.6 per cent of Grade III government-school children could do a subtraction problem; just 30.7 per cent of all Grade V children could solve basic division, rising to 45.8 per cent in Grade VIII.The adolescent picture is more damaging. ASER's 2023 Beyond Basics survey of rural youth aged 14-18 found that only 43.3 per cent could correctly solve a three-digit-by-one-digit division problem. About one in four could not fluently read a Grade II-level text in the regional language. Only 57.3 per cent could read simple English sentences and, among those, 73.5 per cent could explain their meaning. Digital access is also being mistaken for digital capability: 82.2 per cent of 14-16-year-olds knew how to use a smartphone, but only 57 per cent had used one for education in the previous week, while 76 per cent had used one for social media. A young person may navigate a video feed and still be unable to verify a source, fill an online form, protect a password, read a spreadsheet or question an AI answer.The Karnataka evidence cited in the accompanying Counterview report is a warning even in a state associated with technology. Across a 30-district study, 32.7 per cent of Grade I children could not recognise letters, 39.8 per cent could not read words and only about 34 per cent of Grade V children could read at Grade II level. The report also points to roughly 43,000 teacher vacancies and more than 6,150 single-teacher schools. The problem is therefore not only the number of posts. A teacher who has not been prepared for early reading, level-based instruction, practical mathematics, multilingual pedagogy, digital safety or AI ethics cannot acquire those capacities merely because a new online module has been uploaded.  NEP 2020 is written in the future tense. The National Education Policy 2020 imagines a 5+3+3+4 structure, foundational literacy and numeracy, early learning in the home or local language, less rote learning, competency-based assessment, subject flexibility, arts and physical education, vocational exposure from the middle grades, digital learning, inclusion, school complexes and stronger teachers. It expects a learner who can think, communicate, collaborate, solve problems and continue learning. NIPUN Bharat turned the foundational promise into a national mission, with Grade III as the target for basic reading, writing and numeracy. That 2025 deadline has passed, while the learning gap remains.The distance between policy and classroom is not a philosophical disagreement. It is a supply-chain failure. NEP needs time, subject teachers, school leadership, libraries, laboratories, transport, technology, health support and a professional culture that protects teaching. Rural schools too often receive the curriculum as a PDF and reform as a compliance form. They are asked to teach English, mathematics, digital skills and now AI literacy without the staff, equipment and training needed to do so. NEP also refuses the old academic-vocational hierarchy: a rural child should be able to learn algebra and understand a water pump, English and food processing, science and the local craft economy. Too many schools currently provide neither strong foundations nor credible practical pathways.  NITI Aayog's mirror: a chain of small failures. NITI Aayog's May 2026 report, School Education System in India: Temporal Analysis and Policy Roadmap for Quality Enhancement, draws on UDISE+ data from 2014-15 to 2024-25, PARAKH 2024, National Achievement Survey evidence and ASER 2024. Its central value is that it does not reduce the crisis to one statistic. India now has about 14.71 lakh schools serving more than 24.69 crore students, and primary access is close to universal, but higher-secondary gross enrolment is only 58.4 per cent. Government schools' share of enrolment fell from 54.3 per cent to 49.25 per cent over the decade, while private unaided schools rose from 31.7 per cent to 38.8 per cent. The shift reflects demography, migration, consolidation, data cleaning and family choice, but it also signals a weakening public contract.More than one-third of schools have fewer than 50 students. NITI records 1,04,125 single-teacher schools serving 33,76,769 pupils. A national pupil-teacher ratio can therefore look comfortable while a remote teacher is handling several grades, records, meals and surveys. Secondary dropout stood at 11.5 per cent in 2024-25, driven by cost, distance, migration, early work, early marriage, weak foundations and the belief that more schooling will not change a family's income.Infrastructure has improved, but administrative availability is not daily functionality. Functional girls' toilets rose from 85.17 per cent in 2014-15 to a reported 94 per cent in 2024-25, yet 98,592 schools still lacked one; 61,540 had no usable toilet, 14,505 lacked functional drinking water and 59,829 lacked handwashing facilities. Electricity reached 91.9 per cent, but 1.19 lakh schools still lacked functional electricity. Computers were reported in 64.7 per cent of schools, internet in 63.5 per cent and smart classrooms in only 30.6 per cent. PARAKH 2024 showed a national Grade IX pattern of 54 per cent in language, 37 per cent in mathematics, 40 per cent in science and 40 per cent in social science. Inclusion is equally uneven: ramps were reported in 79.1 per cent of schools, while only 33.4 per cent had functional toilets for children with special needs.NITI's diagnosis forms a chain: fragmented schools make staffing difficult; weak staffing produces weak learning; weak learning pushes families towards private options or out of school; falling enrolment then justifies further consolidation. Its answer is connected school complexes, functional infrastructure, shared teachers and facilities, mastery-based pedagogy, welfare support, portable records for migrant children, local accountability, relevant vocational pathways and technology that serves judgement. Each recommendation needs an owner, deadline, public dashboard and consequence when the water, teacher or lesson does not arrive.  Ninety-four thousand doors and the danger of a spreadsheet solution. Between 2014-15 and 2024-25, the UDISE series shows government schools falling from 11.07 lakh to 10.13 lakh. Total school enrolment fell from 26.95 crore to 24.69 crore, while private schools rose broadly from 2.88 lakh to 3.39 lakh. The arithmetic is real, but the headline '94,000 schools closed' does not explain how many were merged, reclassified, cleaned from inactive records or genuinely shut. India has a falling fertility rate, migration and urbanisation. A smaller school-age population will eventually change the network. Yet demography cannot explain away the loss of trust if government schools were consistently useful, safe and aspirational.A well-funded composite school can offer subject teachers, a library, laboratory, sports, counselling and skills that a tiny single-teacher school cannot. But 'within five to ten kilometres' is not a neutral phrase in a mountain village, floodplain, forest or tribal settlement. It means a road, river, monsoon, unsafe stretch, missing bus and a parent who cannot leave work to escort a child. Girls and children with disabilities pay the highest price. Every merger must therefore be tested against travel time, safety, seasonal access, transport cost, attendance, learning and equity. Consolidation should be a service upgrade, never a budget cut or abandonment disguised as rationalisation.  Why families are voting with their feet. Parents do not need a national report to know that a child is behind. They see a paragraph copied without understanding, change counted incorrectly at a market stall, a teacher managing several grades and election duty, and a private school promising English, tests, uniforms, transport and a future. Even when a private school is not objectively stronger, it signals seriousness. The falling government share is not simply a story of affluent families leaving; it is the aspiration of small farmers, construction workers, migrants and landless labourers for children who can read a bank message, compare prices, understand a loan, use a government portal, speak to a customer, migrate safely or build a local enterprise.Quality must therefore mean visible powers: reading a medicine label, calculating a wage, writing an application, understanding a map, identifying a scam, repairing something, growing or selling something and finding the next course. The answer is not a coaching centre or an artificial English accent. It is strong foundations linked to real use: local-language learning, English as a bridge, mathematics through markets and farms, science through water and soil, digital skills through public services and livelihoods, and clear pathways to higher study, apprenticeships and enterprise. Trust returns through repeated visible acts - a clean toilet, a present teacher, a reliable meal, a child who reads better this month, and a parent who can see what the school received and spent.  When the camera enters the school. In August 2026, the youth movement known as the Cockroach Janata Party, or CJP, launched School Thik Karo - Fix the Schools. Its volunteers entered government schools, recorded conditions and published what they saw. The checklist was basic: drinking water and functional toilets; electricity and usable classrooms; boundary walls and campus safety; midday meals and teacher attendance. The visual force of the campaign mattered because a dashboard can say 'infrastructure available' while a phone video shows a broken roof, a clogged toilet, missing windows, children without benches or a class in a borrowed shed. Reports placed such exposures across Madhya Pradesh, Mizoram, Uttarakhand, Bihar, Karnataka, Rajasthan and West Bengal. In Rajasthan, a school in Rampura Kanwarpura was reported to be functioning in a buffalo shed; later reports said the unsafe structure was demolished and a new building of about Rs 18 lakh announced.The campaign also showed how quickly school scrutiny becomes political conflict. In Bankura, West Bengal, CJP volunteer Abdul Hafeez reportedly suffered an attack along with his father, who died two days later from injuries, according to an Al Jazeera account; competing claims about political responsibility remain subject to due process. In Latur, Maharashtra, an FIR was reported against organiser Abhijeet Dipke and others after a teacher alleged unauthorised entry, filming, questioning of students and threats; CJP disputed the account. A Rajasthan team also reported an attack, while a Hingoli headmaster was reportedly suspended after complaints of intoxication and neglect. These allegations require investigation, not headline conviction.Government responses included reported restrictions in Rajasthan on outsider visits, photography, videography and interviews. Maharashtra Chief Minister Devendra Fadnavis dismissed the campaign as a political programme and said most Zilla Parishad schools were good. CJP exposures are not a representative sample, cannot measure learning and cannot replace trained inspections or social audits. But they reveal an accountability weakness. The answer is neither mob inspection nor official secrecy: it is lawful citizen access, child protection, independent audits, transparent school-level records and consequences for failure. Most teachers work under difficult conditions and should not be collectively demonised. Yet a public school must not function as a head teacher's fiefdom.  Money is moving. Trust is not. The Union's 2026-27 budget places total Ministry of Education outlay at about Rs 1,39,289 crore, including roughly Rs 83,562 crore for school education. It lists Rs 42,100 crore for Samagra Shiksha, Rs 12,749.99 crore for PM POSHAN, Rs 7,500 crore for PM SHRI and Rs 3,200 crore for Atal Tinkering Labs. Rajasthan has budgeted Rs 550 crore to repair more than 2,500 schools, Rs 1,000 crore for 400 CM-RISE schools, AI learning labs in 1,000 schools and a School on Wheels in each district, alongside a reported larger infrastructure plan. West Bengal cleared an ADB-backed project of about Rs 2,349.78 crore for roughly 430-432 schools, including classrooms, laboratories, libraries, ramps, toilets, kitchens and teacher development.The scale is welcome, but a model school in a project boundary does not repair every small primary school outside it. NITI notes that public education spending has remained around four per cent of GDP in recent years and records 4.6 per cent in 2021, below the six per cent aspiration associated with the Kothari Commission and NEP 2020. The issue is not only to spend more. It is to weight money towards remoteness, poverty, tribal and migrant populations and disability; release it predictably; ring-fence maintenance; publish its use; and protect teachers from non-teaching work. The real budget test is not a sanctioned amount but a functional service in the village.  The exceptions expose the rule. Kotlapur in Karnataka shows that the public system can revive. Its government school had effectively shut down in 2008 as parents moved children to a nearby private school. When headmaster Dr Vijaya Kumar arrived in 2025, he painted walls, built a Kannada language laboratory and small library, went door-to-door, explained entitlements and rebuilt the school's social presence. The village contributed about Rs 65,000 for CCTV. A fixed deposit of Rs 1,000 a year was created for each Grade I child, to mature after 18 years. Uniforms, books, shoes, socks and eggs made the promise visible. By 2025-26, reported enrolment had reached 42 with four teachers, supported by a School Management Committee.Kotlapur proves both possibility and indictment. Leadership, parent partnership and a visibly better school can restore trust; it is unacceptable that ordinary functionality should depend on a heroic headmaster, donations and personal ingenuity. Kerala's public investment and foundational culture, Tamil Nadu's mother-tongue and welfare emphasis, Himachal Pradesh's access in difficult terrain, Punjab's recent learning gains and community-linked models in Nagaland offer mechanisms worth adapting. The aim is not to copy a state wholesale but to identify what worked and fund it until it becomes routine.The rural school should connect the village to itself and the world. District skill maps can link schools with ITIs, Krishi Vigyan Kendras, self-help groups, cooperatives and practitioners in agriculture, food processing, repair, craft, energy, health, climate, logistics, bookkeeping and digital services. A paid practitioner may mentor a 30-60-hour module, but the teacher must convert experience into language, mathematics, science, design and reflection. Measuring a field, calculating yield, writing an invoice, checking an online payment or verifying an AI answer makes English, mathematics, science, civics and AI literacy useful. Vocational learning must not become caste or class tracking; every module needs bridges to higher study, ITI, polytechnic, apprenticeship, university and enterprise. Five international reminders, not five imports.  China shows the strength and risk of consolidation: better-resourced rural centres, shared expertise, digital links and a nutrition programme reported to benefit more than 37 million students. India can borrow the network logic only with transport, boarding and family contact. South Africa funds poorer schools more through its quintile model and combines no-fee access with nutrition committees. Brazil links social protection to education, redistributes funding through Fundeb and directs at least 30 per cent of federal school-feeding resources to family farming - a cue for deeper local procurement under PM POSHAN.Indonesia's school operational assistance model shows the value of predictable, flexible funds for broken taps, learning materials and connectivity, paired with public ledgers and audits. Finland combines serious teacher preparation with free materials, a daily meal, welfare services and transport when the journey is long or dangerous. India cannot transplant these systems, but it can borrow their principles: weighted equity, local flexibility with transparency, respected teachers, early intervention and the removal of food, health, transport and safety barriers. Ten non-negotiables for a different rural school by 2030.  Functional school guarantee. Every government school should have safe classrooms, drinking water, separate usable toilets, handwashing, electricity, a kitchen, basic furniture, accessibility, a library corner, play space and a maintenance calendar. Dashboards must report monthly functionality, not one-time availability.Rural teacher guarantee. Where there are multiple grades, provide at least two trained primary teachers and named access through a school complex to mathematics, science, English, languages, arts, physical education and vocational learning. Fill vacancies, offer hardship incentives and protect instructional time.Mastery before promotion. Test reading, writing and numeracy at the start of every year, group support by learning level, provide stigma-free catch-up and continue foundational support after Grade III. Assessment must change teaching, not punish children.English and mathematics for use. Build bilingual English around markets, health, work, migration, public services and digital communication. Teach mathematics through money, measurement, time, data, estimation, geometry and reasoning before abstract procedures become meaningless.Human-centred digital and AI literacy. Put power, connectivity, shared devices, offline content and teacher preparation before smart-classroom branding. Teach source checking, privacy, cyber safety, bias, copyright and verification. Children must use tools without surrendering judgement.Consolidate resources without abandoning habitations. Approve mergers only after testing travel, safety, monsoon access, disability access, girls' safety, cost, attendance and learning. Provide buses, bicycles, escorts or hostels when a child must travel.A local multiple-skills curriculum. Offer 30-60-hour modules in agriculture, water, food, repair, craft, energy, health, digital services, climate and enterprise. Pay and train practitioners, award portable credits and keep every academic route open.Nutrition, health and dignity. Strengthen PM POSHAN kitchens, local procurement, menus and social audits. Link schools to health screening, menstrual hygiene, counselling, disability support, physical education and mental-health referral. Track meals served, not meals sanctioned.Open governance and safe scrutiny. Train School Management Committees, give them usable budgets and publish staffing, attendance, facilities, meals, grants, repairs and learning progress without exposing children. Provide lawful observation and protected complaint channels.Weighted finance, leadership and proof. Fund remote, poor, tribal, migrant and disability-heavy schools more per child; release maintenance money predictably; train head teachers as instructional leaders; and publish a rural scorecard based on what children can do, not only what schools possess.  The 2030 test is brutally simple. By 2030, India should answer a child's question without hiding behind enrolment. Can she read a new text and explain it? Can he divide, estimate, measure and reason? Can they use English and a device to learn without losing the strength of their home language? Can they ask whether an AI answer is true, fair and safe? Can they learn a local skill without being sentenced to a caste or occupation? Can they stay through adolescence because transport, food, toilets, health and hope are present?A private tuition market can sell English, a phone can deliver a video and a skill centre can teach a machine. Only a strong public school can combine knowledge, citizenship, nutrition, dignity, peer life, local belonging and a route to the wider world for every child, including the child whose parents cannot pay. The problem is not that rural India has too many public schools. It is that too many have been left with too little capability to justify the faith placed in them. Closing a school may reduce an administrative line; rebuilding it can change a family's trajectory. Kotlapur shows the possible future, CJP shows the cost of leaving the present untouched, and NITI provides the architecture. The remaining requirement is political courage: let citizens see, make teachers capable and respected, fund the last mile and judge the system by the power it gives a child. #RuralEducation, #GovernmentSchools, #EducationInIndia, #RuralIndia, #EducationReform, #NEP2020, #NIPUNBharat, #FoundationalLearning, #EducationEquity, #DigitalLiteracy, #AILiteracy, #VocationalEducation, #PublicEducation, #SchoolInfrastructure, #TeacherShortage, #Education2030, #InclusiveEducation, #CommunityEngagement, #SocialImpact, #SustainableDevelopment ...Read more